USA-Trading-Thread
hat jemannd von Euch eine Idee wenn der DOW mal mit dem Seitwärtstrend aufhört und nach oben geht ?
Hab nämlich einen CALL auf den DOW nur der zieht erst bei 11 bis 12Tausend :-(
Optionen
| Boardmail an "A.D.T." |
Wertpapier: Unlimited Turbo Bear Qu |
On the Inet electronic brokerage network, its shares were trading at $62.70 after closing on Friday at $61.29 on the New York Stock Exchange.
Shares of General Motors Corp. (GM.N: Quote, Profile, Research) rose 1 percent to $24.05 on Inet after sources familiar with the matter said hedge fund Cerberus Capital Management and Citigroup (C.N: Quote, Profile, Research) have teamed up to bid for a controlling stake in the automaker's GMAC financial services unit. General Motors shares closed at $23.80 on Friday.
Shares of Halliburton Co. (HAL.N: Quote, Profile, Research) rose 2.9 percent on Inet to $81.20 after Morgan Stanley raised its price target on the company. Halliburton shares had closed at $78.93 on Friday.
Shares of NMT Medical Inc. (NMTI.O: Quote, Profile, Research) rose 29 percent before the bell after money manager Jim Cramer said the stock could go up to $100 a share on his CNBC television show.
On the electronic brokerage network Inet, NMT Medical shares were trading at $22.26 from their close of $17.26 on the Nasdaq on Friday.
Quelle: http://today.reuters.com/investing/...2006-01-30_13-30-56_N30263294:1
Beste Grüße vom Gesellen 
(Adds revenue figures, other details)
NEW YORK, Jan 30 (Reuters) - Exxon Mobil Corp. (XOM.N: Quote, Profile, Research), the world's largest publicly traded oil company, on Monday reported quarterly profit surged 27 percent, capping a record year dominated by soaring oil and gas prices.
Net income in the fourth quarter was $10.71 billion, or $1.71 a share, compared with $8.42 billion, or $1.30 a share, a year earlier.
Excluding one-time items, the company earned $1.65 per share. Analysts, on average, expected $1.45 per share, according to Reuters Estimates.
Crude oil prices rose about 40 percent last year, driven up by tensions in oil-producing countries like Iran and Nigeria and tight supplies.
Exxon's fourth-quarter revenue jumped to $99.66 billion from $83.37 billion a year earlier but fell short of analysts' average forecast of $101.29 billion.
Exxon shares were up 2.5 percent at $62.82 in pre-market trading on the Inet electronic brokerage system.
Quelle: http://today.reuters.com/investing/...2006-01-30_13-16-10_N30266440:1
Beste Grüße vom Gesellen
Tick bei den Amis leicht negativ und PCR aktuell bei 0,35. Irgenwie sieht mir das nach einem Bruch der 10.900 aus. Ist aber nur ein Bauchgefühl und bitte daher nur als "Gefühlsausbruch" werten ;-)
Beste Grüße vom Gesellen
10.930 oder noch besser über die 10.950 bekommen, dann sollte erstmal ein netter Schub (vermutlich bis zum Jahreshigh) nach oben losgehen. Im Bereich 10.920 - 10.930 hat sich ein ziemlicher Widerstand aufgebaut. Die Bullen rütteln auch schon ziemlich an dem Widerstand!
Ist aber wie immer nur meine Meinung!
Beste Grüße vom Gesellen
Diamant 
Er ist eine Kombination zweier Dreiecke. Das erste Dreieck ähnelt einem umgekehrten symmetrischen Dreieck,
dei dem die beiden Trendlinien aufeinander zulaufen, während bei der umgekehrten Variante die Trendlinien
auseinander driften.
Lässt sich ein Diamant in den Chart einzeichnen, erfolgt immer ein signifikanter Ausbruch in einen starken, Aufwärts- oder Abwärtstrend. Nie aber in einen Seitwärtstrend.
Quelle: http://www.bullchart.de/ta/formationen/index1.php

Derzeit obere Begrenzung bei ca. 10.950.
Beste Grüße vom Gesellen
Allerdings sollte man aufpassen, DOW liebt derzeit, Fehlsignale zu generieren. "Normalerweise" wird so eine Diamantenformation nach unten aufgelöst, aber was ist in dieser Zeit schon normal?
| Updated Thursday, 2/9 for Friday's market. |  | ||||||||||||||
Pop & DropDow rallies sharply to key 10,950 level, but bounces hard to the Close.From prior commentary, "...the Dow has formed a large diamond pattern at the highs of the Q4 rally. This pattern extends from 10,650 to 11,050...continue to watch 10,950 for major signs of strength...” Day's like today really help to reinforce the power of Technical Analysis. In yesterday's commentary, we mentioned the formation of the large diamond pattern that has formed at the highs of the Daily Chart. Well, the Dow rallied sharply right out of the gate for an early 93 point gain. However, the index ran smack into the upper trend line of the diamond at the major 10,950 level that we've been watching the last two weeks. The result was a big reversal from this level to the tune of a 75 point sell-off to the Close. Today's major reversal at 10,950 helps to reinforce not only the level as a major resistance, but also the formation of the diamond pattern. Look for the Dow to wind up between 10,750 and 10,950 over the next week or so as it prepares for a major breakout. It's safe to say that a solid upside break through 10,950 will lead to new highs for not only the current year, but of the last four years. Traditionally, though, diamond patterns are known to break to the downside en route to the formation of a downtrend. We will keep an eye on 10,750 as the ultimate point of a breakdown, as such a break could finally lead to a decisive trend. Short Term Dow The Dow broke an intraday support level at 10,910 en route to the afternoon decline, seen in the 5 Minute Chart. Use this level as a fulcrum for early movement tomorrow morning. Medium Term Dow In the medium term, we barely triggered Longs in the Dow at 10,950, giving us a loss for the trade. We are out of the market and will watch 10,950 up, and 10,750 down; using 20 point stops. NASDAQ & S&P The NASDAQ and S&P each pushed solidly higher in the first half of the session, but later topped out en route to a steady decline to the Close. Look for the indexes to gather themselves ahead of the next key breakout. Summary The Dow closed the day with a steady decline from the session's highs, which occurred after topping out at 10,950. Look for the index to continue trading sideways toward the apex of the diamond pattern as a breakout approaches. Thanks for listening, and Good luck in your trading! Ed Downs with assistance from.. ** Note: We are now posting Index entries and exits in Real Time, through our new Intraday Index Alerts service. To learn more about the service, visit SignalWatch.com and select Intraday Alerts from the main navigation bar. - SW Team _________________________ |
| ||||||||||||||


Beste Grüße vom Gesellen
By Melanie Cheary
LONDON, Feb 10 (Reuters) - U.S. stock futures pointed to a firmer start for Wall Street on Friday with subdued oil prices likely to lend support on a quiet day for company results and as investors await key U.S. trade data this afternoon.
Few major companies are scheduled to report results, among them Coventry Health Care Inc (CVH.N: Quote, Profile, Research) and Ecolab Inc (ECL.N: Quote, Profile, Research).
But Oracle Corp. (ORCL.O: Quote, Profile, Research) will be in focus after announcing hefty job cuts after the closing bell, while video game developer Atari Inc. (ATAR.O: Quote, Profile, Research) will also draw attention after reporting an unexpected quarterly loss.
Strategists say while sentiment remains positive as most companies in the S&P 500 index meet or exceed earnings forecasts, U.S. stock markets are likely to consolidate at least until the first Federal Reserve interest rate decision by Ben Bernanke, successor to Alan Greenspan, in March.
By 1056 GMT S&P <SPH6>, Nasdaq <NDH6> and Dow Jones industrial average futures <DJH6> were up around 0.2 percent.
"Even though there have been a few fund managers cutting their exposure to U.S. equities, the earnings season has proved almost as good as Q3 last year and subdued oil prices could help lift confidence levels. Just over 65 percent of companies in the S&P 500 that have reported have met or exceeded forecasts," said Angus Campbell, market strategist at Finspreads.
Crude prices remained under $63 a barrel but edged a little higher as the prospect of supply disruptions deflected attention from swelling U.S. inventories and stemmed a losing streak that has seen oil shed $5 since late January. "Today's major focus will be the U.S. trade balance which is expected to widen a little to $65 billion. Anything greater than the high end estimate of $68.6bn could cause concern among investors that the trade deficit is starting to take up too greater percentage of GDP," Campbell said.
Dollar-sensitive U.S. trade data is due to be released at 1330 GMT amid growing concern about the competitiveness of U.S. exporters, especially after recent news of huge job cuts at American car companies.
AFTER THE BELL
In U.S. corporate news, Oracle said it will cut 2,000 jobs in connection with its acquisition of software maker Siebel Systems and gave a profit outlook for the remainder of the year roughly in line with Wall Street estimates.
In extended trade, the stock slipped 1.5 percent to $12.50. For more double click on [ID:nN09227370]
Video game developer Atari said there was "substantial doubt" about its ability to continue as a going concern and reported an unexpected quarterly loss, sending shares down more than 40 percent in after-hours trade. For more double click on [ID:nNB3335436]
Elsewhere, New York Mercantile Exchange President James Newsome has said the exchange could "realistically" proceed with an initial public offering in September or October, which would follow plans to brings in electronic trading to run alongside its open outcry system. For more double click on [ID:nN095356]
Meanwhile, the initial public offering of insurer AmComp Inc. is priced at $9 per share, at the low end of forecast of $9 to $11 per share, according to an underwriter. The 10.5 million share offer is worth $94.5 million.
Non S&P 500 companies due to report later include Ambassadors Group Inc (EPAX.OQ: Quote, Profile, Research), Avista Corp (AVA.N: Quote, Profile, Research), Diagnostics Products Corp (DP.N: Quote, Profile, Research), Mettler-Toledo International Inc (MTD.N: Quote, Profile, Research) and WCI Communities Inc (WCI.N: Quote, Profile, Research).
Quelle: http://today.reuters.com/investing/...2006-02-10_10-59-16_L10521065:1
Beste Grüße vom Gesellen
Also mein Szenario sieht wie folgt aus:
Auflösung des Diamanten noch diese Woche und zwar nicht Regelkonform. Einfach mal nach oben ausbrechen, gap schließen, dabei die shorties verunsichern und die long-player an board holen. Trotzdem denke ich, dass wir Ende dieser Woche/Anfang nächster Woche tiefer stehen im DOW als im Moment (ca. 10.900).
Ist aber nur meine Meinung und nur ein Szenario! KEINE Kauf- oder Verkaufsempfehlung!!! Dies wäre nur das Szenario mit dem höchsten Unterhaltungsfaktor *ggg*
| Updated Friday, 2/10 for Monday's market. | | ||||||||||||||
Drop & PopDow sells off at Open, but stages big rally back to key 10,950 level.From prior commentary, "...Today's major reversal at 10,950 helps to reinforce not only the level as a major resistance, but also the formation of the diamond pattern. Look for the Dow to wind up between 10,750 and 10,950 over the next week or so as it prepares for a major breakout...” The Dow opened the session with another steady flow of weakness this morning, but reversed from the lows in what slowly became a solid upside rally back to the major 10,950 resistance level, as seen in the 15 and 60 Minute Charts. The Dow covered 125 points of ground today and eventually closed the day higher by 36 points before halting just before 10,950. This is the third key touch at or near 10,950 in the last 8 sessions, with the previous two touches being met with sharp sell-offs. Looking at the Daily Chart shows the diamond pattern continues to develop in perfect fashion, which the upper trend line falling neatly at 10,950. As we mentioned before, this is a very clear and solid fulcrum in the charts and should be eyed carefully. Since the entire market is watching this level, we could see a bit of whipsaw activity ahead of breakout. We will likely test the year's highs at 11,050 should this level be crossed with force. We could see another few days of increased volatility within the boundaries of the diamond before a breakout actually occurs. Should the index break back below 10,820, a test at 10,750 should be expected. Watch 10,750 for major, medium term downside movement. Short Term Dow The Dow halted the afternoon's advance just 5 points shy of 10,950, seen in the 5 Minute Chart. Watch this level for early signs of initial movement Monday morning. Medium Term Dow In the medium term, we are still out of the market and will watch 10,950 up, and 10,800 down; using 20 point stops. NASDAQ & S&P The NASDAQ and S&P each performed mid-day reversals for the second straight session today, but this time, the day was capped with a rally. Watch the key resistance level that will be coming into play. Summary The Dow ended the day with a nice 36 point gain after initially selling of by as much as 63 points early in the session. The index is once again within a stone's throw of testing major resistance at 10,950. An upside break or reversal at this level could make for a big reaction Monday. Thanks for listening, and Good luck in your trading! Ed Downs with assistance from.. ** Note: We are now posting Index entries and exits in Real Time, through our new Intraday Index Alerts service. To learn more about the service, visit SignalWatch.com and select Intraday Alerts from the main navigation bar. - SW Team _________________________ |
| ||||||||||||||


Quelle: http://www.signalwatch.com/markets/markets-dow.asp?Date=02/13/06
Beste Grüße vom Gesellen
meint ihr dass sich der DJ bis Mi behaupten kann?
Oder meint ihr dass er abwartet ob es eine Zinsentscheidung gibt ?
Optionen
| Boardmail an "A.D.T." |
Wertpapier: Unlimited Turbo Bear Qu |
rengekommen. Also ich denke, der DOW wird bis Mittwoch 15.2. sich behaupten können. Denke sogar, dass er in Richtung neue highs blicken wird.
Mein Szenario hab ich in #134 geschrieben ;-) Tja, da hat sich keiner getraut, dafür einen grünen zu vergeben *ggg*
Beste Grüße vom Gesellen
Aus fundamentaler Sicht sehe ich keinen Grund für einen weiterern Aufschwung an den Börsen.
gruss
permanent
nur noch Kohlestaub ;-) Ob weiteres Aufwärtspotential besteht, ist eine gute Frage. Die (vorlaufende) Stochastik beim DOW z.B. befinden sich derzeit am oberen Anschlag (und zwar in allen Zeitfenstern! Inkl. den daily, weekly und monthly). Dies ist noch keine Garantie, dass es jetzt nach unten geht. Long würde ich im Moment allerdings auch nicht gehen. Sollte der DOW über die 11.075/80 laufen, kann es sehr schnell bis 11.350/450 gehen!
Ich persönlich bin bearish eingestellt, was an mehreren Faktoren hängt. So sind derzeit die comercial traders noch massiv short eingestellt, auch wenn sich dies im Moment etwas ändert. Entweder hatten die comercial traders mit einem Einbruch gerechnet und müssen jetzt doch überraschend wieder long gehen, oder es kommt da noch ein Rutsch.
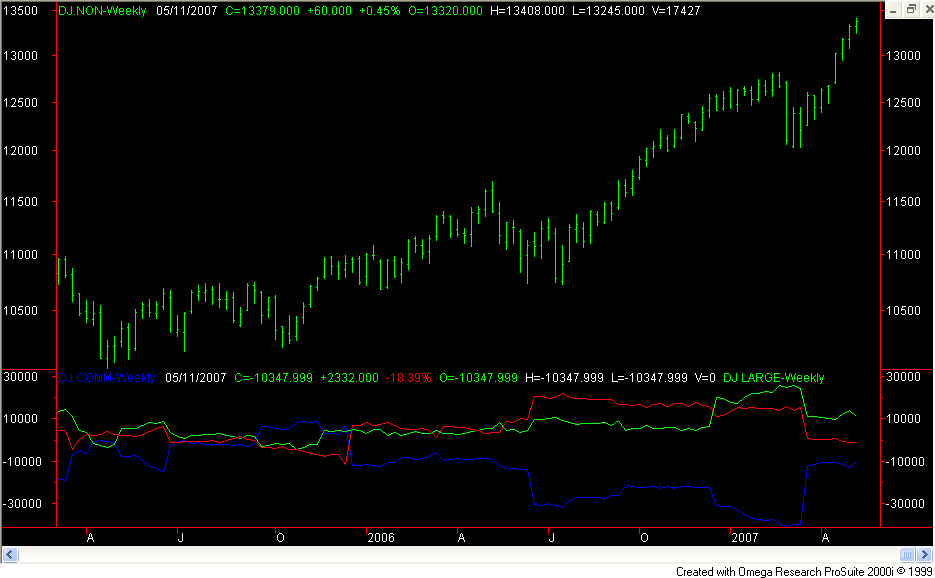
blue = commercial traders | green = large traders | red = small traders
Es gibt noch weitere Faktoren, allerdings muß ich jetzt gleich zum Kunden. Ich werde versuchen, heute Nachmittag noch ein paar Punkte zu benennen.
Aber dennoch, mein Fazit: Die "Gefahr" einer Übertreibung nach oben (short squeeze) ist durchaus gegeben! Ich sehe aber derzeit die größeren Chancen auf der short-Seite. Allerdings sollte man (falls man jetzt einsteigen möchte) eher weitere Scheine nehmen! Wer clever ist, der wartet jetzt erst einmal ab, ob noch ein short-squeeze kommt. Falls nicht, dann gibt es noch genügend Punkte auf dem Weg nach unten zu verdienen. Eile ist daher nicht geboten.
Ist aber nur mein persönliches Fazit und übernehme keine Garantie, dass es auch wirklich so kommt ;-)
Beste Grüße vom Gesellen
Sprich: auf welche Futures greifen diese zurück? Sind dabei auch die Mini-sized Futures mit inbegriffen?
Danke für Deine Antwort. ;-)
Gruß
 Salut!
Begrenze Deine Verluste und Du kannst Dich Deiner Gewinne nicht erwehren!
DOW_-_langfristig.png (verkleinert auf 63%)

Warum soll ich jetzt short gehen, wenn ich absolut kein Shortsignal habe?
Schau dir einmal Charts an, wie oft sich die Aufwärtsbewegung noch beschleunigt bei der Stoch am Anschlag.
Auch wenn ich nur Swingtrader bin, warum soll ich auf Verdacht short gehen wenn auch noch über 200 Punkte nach oben drinne sind?
Dann warte ich doch lieber ab und riskiere nicht einen Position ins Minus laufen zu lassen um dann zu hoffen, daß endlich die Umkehr kommt.
Mache Dir einfach auch mal die Mühe und schaue Dir die Einzelwerte im Dow an.
Da haben einige nämlich erst gerade Kaufsignale geliefert.
Gruß, hardyman

Optionen
| Boardmail an "hardyman" |
Wertpapier: Unlimited Turbo Bear Qu |
http://www.tradesignal.com/content.asp?p=wsn/artikel.asp&id=1325 .
Im Prinzip wird damit ausgedrückt wie nah der Schlußkurs am High/Low liegt und simple Gemüter schließen daraus was steigt muß 'bald' wieder fallen und umgekehrt. Dieses 'bald' kann aber noch einige Tage oder viele Punkte dauern. Deswegen hat auch schon Florek in seinem Buch 'Neue Trading Dimensionen' vor dieser allgemeinen Auslegung der Stochastic gewarnt. Besser ist es die Richtungsänderung der Stochastic und/oder das Schneiden des Durchschnittes in seine Analyse einzubeziehen.
@Hardy,
1. der Diamant ist daher "futsch", da er gemäß Definition (siehe #131) i.d.R an einem Kurshoch auftritt. Nachdem es weiter nach oben ging, ist dies kein Kurshoch und m.M. nach die Diamantenformation nicht gegeben!
2. Wenn Du meinen Beitrag richtig gelesen hast, dann wirst Du feststellen, dass ich nicht gesagt habe, dass man jetzt short gehen muß! Zitat: "Wer clever ist, der wartet jetzt erst einmal ab, ob noch ein short-squeeze kommt. Falls nicht, dann gibt es noch genügend Punkte auf dem Weg nach unten zu verdienen. Eile ist daher nicht geboten". Ich sehe für mich derzeit die Chancen eher auf der short-Seite größer, als auf der long-Seite.
Das ich im Moment short bin, und das schon seit einigen Punkten, ist im Nachhinein gesehen sicherlich ein Fehler. Dies hängt aber mit vielen Faktoren zusammen, die u.a. persönliche Gründe haben bzw. arbeitsbedingt sind. Meine Entscheidung, mein Risiko, keine Handlungsempfehlung (wie ich auch immer dazu schreibe).
@Antoine: Die Definitionen der verschiedenen trader gemäß dem Ersteller des Charts
About Free COT Charts
Free COT Charts is a website devoted to charting the weekly Commitments of Traders or "COT". The net positions of these commitments are what's actually plotted, that is, the long positions minus the short positions = the net positions. These numbers are provided by the Commodity Futures Trading Commission or "CFTC". Each Friday the CFTC issues that weeks commitments which reflects the previous Tuesdays positions of 3 trading groups. The CFTC classifies these 3 groups of traders as follows.
Commercials - Producers and end users of the commodity or futures market they participate in are referred to as commercials. This group is the reason the commodity and futures markets exist, to allow "commercials" an opportunity to defer or hedge the risk of doing business. Free COT Charts plots commercials net positions (shown as comm) in blue. (This smart money group will often get aggressively net long or short prior to major trends) A horizontal line is drawn to show the zero line of the commercials net positions.
Large Speculators - Defined as those traders who hold a specified number of contracts or greater in a given market, but are not commercial traders. The CFTC sets the minimum number of contracts that can be held before the speculator is required to report that position. Any speculator participating in a market that is required to report to the CFTC is known as a non-commercial or large trader. Free COT Charts plots large traders net positions (shown as large) in green. (This group follows trends and usually mimics the markets price movement) A horizontal line is drawn to show the zero line of the large traders net positions.
Small Speculators - Any market participant who is neither a commercial nor non-commercial is a small speculator. This group is not required to report to the CFTC but can determined by the contracts left over after the commercials and non-commercials have been accounted for. Free COT charts plots small speculators net positions (shown as specs) in red. (This over-leveraged group is usually wrong at major turning points) A horizontal line is drawn to show the zero line of the small speculators net positions.
Quelle: http://www.freecotcharts.com/about.htm
@Migi, sehe den Widerstand eher bei 11.060, aber um ein paar Punkte braucht man sich ja nicht streiten ;-) Daher auch die Aussage "Sollte der DOW über die 11.075/80 laufen, kann es sehr schnell bis 11.350/450 gehen!"
@All, freue mich, dass jetzt wieder einige mehr sich hier beteiligen ;-)
Nachtrag zu Chart in #138
Ist mir vorhin erst so aufgefallen, aber am ehesten haben die "large traders" in letzter Zeit richtig gelegen. Was keine Garantie ist, dass die immer richtig liegen!!! Bitte jeder eigene Gedanken dazu anstellen!!!
Beste Grüße vom Gesellen
Eine Seite über CoT-Daten habe ich hier, falls Du Dich dafür interessierst: LINK
;-)
Gruß
Salut!
Begrenze Deine Verluste und Du kannst Dich Deiner Gewinne nicht erwehren!
Lässt sich ein Diamant in den Chart einzeichnen, erfolgt immer ein signifikanter Ausbruch in einen starken, Aufwärts- oder Abwärtstrend. Nie aber in einen Seitwärtstrend.
Du hast aber Recht in der Regel sollte er nach unten aufgelöst werden bei einem Top.
Die Fehlerquote beträgt aber ca. 25% und der Ausbruch erfolgt nach oben, deshalb war es trotzdem ein Diamant!
Die meisten wissen wahrscheinlich nicht einmal das es sogar eine Diamantenbodenbildung nach einem starken Abwärtstrend gibt.
Da ist die Fehlerquote nur bei ca. 13%.
Gruß, hardyman
Optionen
| Boardmail an "hardyman" |
Wertpapier: Unlimited Turbo Bear Qu |
Gruß TT
Vermute mal Du hast den selben dicken Schmöker wie ich auf dem Schreibtisch stehen.
Gruß, hardyman
Optionen
| Boardmail an "hardyman" |
Wertpapier: Unlimited Turbo Bear Qu |
Das sollte der nächste Wiederstand sein.
Ich bin übrigens auch nicht long im Dow.
Gruß, hardyman
Optionen
| Boardmail an "hardyman" |
Wertpapier: Unlimited Turbo Bear Qu |