Rebound........TEIXEIRA DUARTE NAM.
Seite 1 von 2 Neuester Beitrag: 25.04.21 00:42 | ||||
| Eröffnet am: | 22.07.08 11:30 | von: buran | Anzahl Beiträge: | 49 |
| Neuester Beitrag: | 25.04.21 00:42 | von: Simonequaea | Leser gesamt: | 5.372 |
| Forum: | Hot-Stocks | Leser heute: | 1 | |
| Bewertet mit: | ||||
| Seite: < 1 | 2 > | ||||
Kurs Alle Handelsplätze, Times & Sales >>
Letzter Vortag Umsatz Veränderung
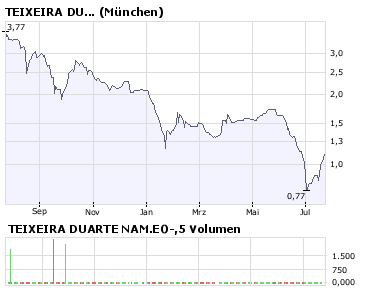
1,10 € 1,06 € 0 € +3,77%
Handelsplatz: München Stand: 09:05
Optionen
| Boardmail an "buran" |
Wertpapier: Teixeira Duarte |
Angehängte Grafik:
bigchart.png
bigchart.png
Herkunft Portugal
Aktienanzahl 420,0 Mio. (Stand: 19.08.12)
Marktkap. 209,2 Mio. €
GrB
Optionen
| Boardmail an "buran" |
Wertpapier: Teixeira Duarte |
Optionen
| Boardmail an "buran" |
Wertpapier: Teixeira Duarte |
Optionen
| Boardmail an "buran" |
Wertpapier: Teixeira Duarte |
Zeit Kurs Stück
09:34:01 0,65 € 7.000
08:03:34 0,654 € 0
Herzlichen Glückwunsch ..also zu Geld gemacht ..tolles Spiel ..so sind die Regeln
buran,Der SPIELER
Optionen
| Boardmail an "buran" |
Wertpapier: Teixeira Duarte |
Frankfurt 0,635 €
München 0,661 €
Stuttgart 0,625 €
Berlin 0,634 €
GrB
Optionen
| Boardmail an "buran" |
Wertpapier: Teixeira Duarte |
.........RTK 0,64 € ,GrB
Optionen
| Boardmail an "buran" |
Wertpapier: Teixeira Duarte |
Date: 7-Sep-13
Contributor: Reuters Investment Profile
Title: Teixeira Duarte SA: Business description, financial summary, 3yr and interim financials, key statistics/ratios and historical ratio analysis.
Document Size: 12 pages
Price: $138
Document Type: Adobe Acrobat Reader®
Download free Adobe Acrobat Reader®
http://reports.finance.yahoo.com/w0?r=49516335:1
Optionen
| Boardmail an "buran" |
Wertpapier: Teixeira Duarte |
Sep 20, 2013 0.66 0.66 0.65 0.65 17,500 0.65
Sep 19, 2013 0.65 0.66 0.65 0.66 17,300 0.66
Sep 18, 2013 0.65 0.67 0.65 0.65 27,000 0.65
Sep 17, 2013 0.66 0.66 0.65 0.66 35,400 0.66
Sep 16, 2013 0.63 0.66 0.63 0.66 49,400 0.66
Sep 13, 2013 0.63 0.64 0.63 0.64 14,400 0.64
Sep 12, 2013 0.64 0.65 0.62 0.65 118,900 0.65
Sep 11, 2013 0.64 0.64 0.64 0.64 10,000 0.64
Sep 10, 2013 0.64 0.66 0.64 0.65 119,500 0.65
Sep 9, 2013 0.64 0.65 0.64 0.64 80,700 0.64
Sep 6, 2013 0.65 0.65 0.62 0.64 79,000 0.64
Sep 5, 2013 0.66 0.66 0.64 0.64 74,100 0.64
Sep 4, 2013 0.65 0.67 0.65 0.65 24,500 0.65
Sep 3, 2013 0.66 0.66 0.65 0.65 39,900 0.65
Sep 2, 2013 0.68 0.69 0.64 0.65 113,100 0.65
Aug 30, 2013 0.67 0.68 0.67 0.67 4,200 0.67
Aug 29, 2013 0.64 0.67 0.64 0.67 61,900 0.67
Aug 28, 2013 0.65 0.65 0.64 0.64 11,900 0.64
Aug 27, 2013 0.66 0.67 0.66 0.66 52,000 0.66
Aug 26, 2013 0.67 0.67 0.66 0.67 37,300 0.67
Aug 23, 2013 0.67 0.67 0.65 0.65 11,000 0.65
Aug 22, 2013 0.65 0.66 0.65 0.66 27,000 0.66
Aug 21, 2013 0.65 0.65 0.65 0.65 1,500 0.65
Aug 20, 2013 0.65 0.65 0.64 0.65 55,500 0.65
Aug 19, 2013 0.67 0.67 0.65 0.67 77,700 0.67
Aug 16, 2013 0.66 0.68 0.64 0.68 101,200 0.68
Aug 15, 2013 0.63 0.68 0.63 0.65 152,300 0.65
Aug 14, 2013 0.63 0.64 0.61 0.63 284,900 0.63
Aug 13, 2013 0.61 0.63 0.61 0.62 91,700 0.62
Aug 12, 2013 0.60 0.61 0.59 0.61 201,000 0.61
Aug 9, 2013 0.58 0.61 0.57 0.60 220,800 0.60
Aug 8, 2013 0.55 0.58 0.55 0.58 53,100 0.58
Aug 7, 2013 0.54 0.55 0.54 0.55 188,100 0.55
Aug 6, 2013 0.55 0.55 0.54 0.54 4,100 0.54
Aug 5, 2013 0.55 0.55 0.55 0.55 7,700 0.55
Aug 2, 2013 0.56 0.56 0.55 0.55 14,900 0.55
Aug 1, 2013 0.55 0.58 0.54 0.57 185,300 0.57
Jul 31, 2013 0.54 0.55 0.53 0.55 103,500 0.55
Jul 30, 2013 0.52 0.55 0.52 0.55 104,200 0.55
Jul 29, 2013 0.52 0.52 0.52 0.52 1,900 0.52
Jul 26, 2013 0.54 0.54 0.53 0.53 22,800 0.53
Jul 25, 2013 0.53 0.53 0.52 0.52 14,600 0.52
Jul 24, 2013 0.53 0.53 0.52 0.52 28,500 0.52
Jul 23, 2013 0.52 0.54 0.52 0.52 43,100 0.52
Jul 22, 2013 0.52 0.55 0.52 0.54 92,300 0.54
Jul 19, 2013 0.52 0.54 0.52 0.52 51,600 0.52
Jul 18, 2013 0.50 0.55 0.50 0.55 60,400 0.55
Jul 17, 2013 0.50 0.52 0.50 0.52 16,100 0.52
Jul 16, 2013 0.50 0.51 0.50 0.51 3,800 0.51
Jul 15, 2013 0.51 0.51 0.50 0.51 14,000 0.51
Jul 12, 2013 0.52 0.54 0.51 0.51 32,300 0.51
Jul 11, 2013 0.55 0.55 0.51 0.51 77,300 0.51
Jul 10, 2013 0.56 0.57 0.55 0.56 7,900 0.56
Jul 9, 2013 0.56 0.56 0.56 0.56 37,000 0.56
Jul 8, 2013 0.56 0.57 0.56 0.56 30,000 0.56
Jul 5, 2013 0.56 0.56 0.55 0.55 19,100 0.55
Jul 4, 2013 0.53 0.57 0.53 0.55 172,700 0.55
Jul 3, 2013 0.54 0.54 0.49 0.51 429,900 0.51
Jul 2, 2013 0.59 0.60 0.58 0.58 49,200 0.58
Jul 1, 2013 0.57 0.59 0.55 0.59 64,300 0.59
Jun 28, 2013 0.58 0.58 0.56 0.56 45,600 0.56
Jun 27, 2013 0.56 0.57 0.56 0.57 26,600 0.57
Jun 26, 2013 0.58 0.58 0.57 0.58 77,200 0.58
Jun 25, 2013 0.56 0.58 0.56 0.58 52,500 0.58
Jun 24, 2013 0.59 0.59 0.55 0.57 123,300 0.57
Jun 21, 2013 0.60 0.60 0.58 0.59 87,300 0.59
* Close price adjusted for dividends and splits
http://finance.yahoo.com/q/hp?s=TDSA.LS+Historical+Prices
Optionen
| Boardmail an "buran" |
Wertpapier: Teixeira Duarte |
Prev Close: 0.65
Open: 0.65
Bid: 0.66
Ask: 0.67
1y Target Est: N/A
Beta: N/A
Next Earnings Date: N/A
Day's Range: 0.65 - 0.66
52wk Range: 0.24 - 0.69
Volume: 53,181
Avg Vol (3m): 69,687
Market Cap: N/A
P/E (ttm): N/A
EPS (ttm): N/A
Div & Yield: N/A (N/A)
http://finance.yahoo.com/...lcvalues=0;logscale=off;source=undefined;
Optionen
| Boardmail an "buran" |
Wertpapier: Teixeira Duarte |
09:07:09 0,64 € 2.500
09:05:20 0,64 € 5.000
__________________
GRATULATION
Optionen
| Boardmail an "buran" |
Wertpapier: Teixeira Duarte |
..........::hopshopshopshopshopshopshopshopshopshopshopshopshopshops
Optionen
| Boardmail an "buran" |
Wertpapier: Teixeira Duarte |
Optionen
| Boardmail an "buran" |
Wertpapier: Teixeira Duarte |
Optionen
| Boardmail an "buran" |
Wertpapier: Teixeira Duarte |
Datum Erster Hoch Tief§Schluss Stücke Volumen 04.12.13 0,908 0,908 0,901 0,901 € 4.000 3.604
..manchmal bin ich das buran so traurig verbittert verheult ..dass ich anfangen muss zu lachen ..auf dass die Ticker Lampen an den Börsenplätzen weiter für immer und immer platzend krachen
gez. unter Tränen buran & TEIXEIRA,Die Börsen Gerührten Ticker Lampen Heulsusen
Optionen
| Boardmail an "buran" |
Wertpapier: Teixeira Duarte |
WKN: A1C3ME Typ: Aktie
SK 0,92 € SKP +3,25 Pott -13,21%
buran und MfG und schüddelbööööön
Optionen
| Boardmail an "buran" |
Wertpapier: Teixeira Duarte |
Open:1.20
Bid: 1.15
Ask: 1.16§
1y Target Est: N/A
Beta: N/A§
Next Earnings Date: N/A
Day's Range: 1.12 - 1.21
52wk Range: 0.36 - 1.44
Volume: 976,233§
Avg Vol (3m): 256,131
Market Cap: N/A
P/E (ttm): N/A
EPS (ttm): N/A
Div & Yield: N/A (N/A)
http://finance.yahoo.com/q?s=TDSA.LS
Optionen
| Boardmail an "buran" |
Wertpapier: Teixeira Duarte |
Date: 11-Jan-14
Contributor:§Reuters Investment Profile
Title:§Teixeira Duarte SA: Business description, financial summary, 3yr and interim financials, key statistics/ratios and historical ratio analysis.
Document Size: 12 pages
Price: $138
Document Type: Adobe Acrobat Reader®
Download free Adobe Acrobat Reader®
http://reports.finance.yahoo.com/w0?r=49516335:1
Optionen
| Boardmail an "buran" |
Wertpapier: Teixeira Duarte |
Herkunft Portugal §
Aktienanzahl§420,0 Mio. (Stand: 19.08.12)
Marktkap.§445,6 Mio. €
buran und MfG
Optionen
| Boardmail an "buran" |
Wertpapier: Teixeira Duarte |
Optionen
| Boardmail an "buran" |
Wertpapier: Teixeira Duarte |
Düsseldorf 0 1,058 € 1,072 € 0 1,32% 12:55:33
Frankfurt 7.600 1,058 € 1,072 € 7.600 1,32% 12:55:30
München 5.000 1,055 € 1,075 € 5.000 1,90% 12:55:30
Berlin 2.000 1,007 € 1,124 € 30.831 11,62% 13:31:38
Stuttgart 50.000 0,977 € 1,149 € 50.000 17,60% 13:21:12
buran und MfG und trullala und trallala
Optionen
| Boardmail an "buran" |
Wertpapier: Teixeira Duarte |
Optionen
| Boardmail an "buran" |
Wertpapier: Teixeira Duarte |
Berlin, 25.08.14:::::::: yeeaaahhhh
Optionen
| Boardmail an "buran" |
Wertpapier: Teixeira Duarte |
Optionen
| Boardmail an "buran" |
Wertpapier: Teixeira Duarte |