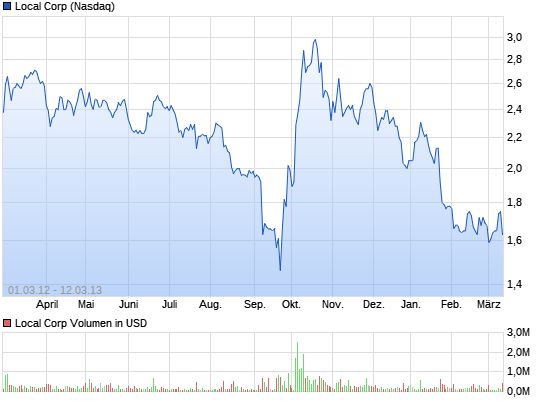
Local.com aussichtsreich
Seite 196 von 373 Neuester Beitrag: 25.04.21 00:22 | ||||
| Eröffnet am: | 03.11.09 12:52 | von: Libuda | Anzahl Beiträge: | 10.314 |
| Neuester Beitrag: | 25.04.21 00:22 | von: Franziskakuf. | Leser gesamt: | 671.793 |
| Forum: | Hot-Stocks | Leser heute: | 114 | |
| Bewertet mit: | ||||
| Seite: < 1 | ... | 194 | 195 | | 197 | 198 | ... 373 > | ||||
Local Corp development of Unique Visitors:
11/2012: 18,745,842 Monthly Unique Visitors
12/2012: 22,738,206 Monthly Unique Visitors
01/2013: 26,410,927 Monthly Unique Visitors
02/2013: 24,017,605 Monthly Unique Visitors
Decrease of 9.06% (but February has only 28 days against 31 in January) against January and an increase of 38.64% year-over-year.
Compare with the development of Yelp's Unique Visitors:
11/2012: 19,358,705 Monthly Unique Visitors
12/2012: 21,017,483 Monthly Unique Visitors
01/2013: 22,293,301 Monthly Unique Visitors
02/2013: 21,063,155 Monthly Unique Visitors
Decrease of 5.52% (but February has only 28 days against 31 in January) against January and an increase of 12.66% year-over-year.
Compare with the development of Google's Unique Visitors:
11/2012: 170,708,977 Monthly Unique Visitors
12/2012: 172,771,973 Monthly Unique Visitors
01/2013: 174,123,575 Monthly Unique Visitors
02/2013: 173,396,028 Monthly Unique Visitors
Decrease of 0.42% (but February has only 28 days against 31 in January) against January and an increase of 10.73% year-over-year.
Compare with the development of Zillow’s Unique Visitors Google:
11/2012: 10,978,144 Monthly Unique Visitors
12/2012: 11,366,564 Monthly Unique Visitors
01/2013: 14,298,071 Monthly Unique Visitors
Decrease of 6.17% (but February has only 28 days against 31 in January) against January and an increase of 45.23% year-over-year.
Optionen
| Boardmail an "JaminGottfried" |
Wertpapier: Local Corp |
Market-Cap of Local Corp = 36 million
Market-Cap of Zillow = 1,720 million
Local Corp development of Unique Visitors:
11/2012: 18,745,842 Monthly Unique Visitors
12/2012: 22,738,206 Monthly Unique Visitors
01/2013: 26,410,927 Monthly Unique Visitors
02/2013: 24,017,605 Monthly Unique Visitors
Decrease of 9.06% (but February has only 28 days against 31 in January) against January and an increase of 38.64% year-over-year.
Compare with the development of Zillow’s Monthly Unique Visitors:
11/2012: 10,978,144 Monthly Unique Visitors
12/2012: 11,366,564 Monthly Unique Visitors
01/2013: 14,298,071 Monthly Unique Visitors
02/2013: 13,415,496 Monthly Unique Visitors
Decrease of 6.17% (but February has only 28 days against 31 in January) against January and an increase of 45.23% year-over-year.
Das ist nur die Flagship-Seite. Hinzu kommen noch die Zahlen der Monthly Unique Visitors, die über das Netzwerk kommen, die aber bei jeweiligen Internetauftritten der meist lokalen Zeitungszeiten gezählt werden.
http://siteanalytics.compete.com/yelp.com/
Die Zahlen von Siteanalytics sind nur die US-Zahlen, Yelp ist aber stärker auch auf Auslandmärkten vertreten als Local Corp.
Ad Summary from vipcares.com: get-an-instant-quote-today-compareprices-and-find-the-best-deals/?show=all: Insurancelow has 32 ads
The vertical insurancelow are working and producing lead generations and provisions
11/2012: 18,745,842 Monthly Unique Visitors
12/2012: 22,738,206 Monthly Unique Visitors
01/2013: 26,410,927 Monthly Unique Visitors
02/2013: 24,017,605 Monthly Unique Visitors
Decrease of 9.06% (but February has only 28 days against 31 in January) against January and an increase of 38.64% year-over-year.
Compare with the development of Yelp's Unique Visitors:
11/2012: 19,358,705 Monthly Unique Visitors
12/2012: 21,017,483 Monthly Unique Visitors
01/2013: 22,293,301 Monthly Unique Visitors
02/2013: 21,063,155 Monthly Unique Visitors
Decrease of 5.52% (but February has only 28 days against 31 in January) against January and an increase of 12.66% year-over-year.
Compare with the development of Google's Unique Visitors:
11/2012: 170,708,977 Monthly Unique Visitors
12/2012: 172,771,973 Monthly Unique Visitors
01/2013: 174,123,575 Monthly Unique Visitors
02/2013: 173,396,028 Monthly Unique Visitors
Decrease of 0.42% (but February has only 28 days against 31 in January) against January and an increase of 10.73% year-over-year.
Compare with the development of Zillow’s Unique Visitors:
11/2012: 10,978,144 Monthly Unique Visitors
12/2012: 11,366,564 Monthly Unique Visitors
01/2013: 14,298,071 Monthly Unique Visitors
02/2013: 13,415,496 Monthly Unique Visitors
Decrease of 6.17% (but February has only 28 days against 31 in January) against January and an increase of 45.23% year-over-year.
Compare between 2-month-period January/February 2013 with same period in 2012:
01/2012 = 18,745,778 Monthly Unique Visitors
02/2012 = 17,323,693 Monthly Unique Visitors
That are together in 01/2012 and 02/2012 = 36,069,471 Monthly Unique Visitors.
01/2013 = 26,410,927 Monthly Unique Visitors
02/2013 = 24,017,605 Monthly Unique Visitors
That are together in 01/2013 and 02/2013 = 50,428,532 Monthly Unique Visitors
We believe 2013 will be a great year for us with second highest adjusted net income ever and with a far more defensable blend of revenue
"In light of both the commitment of management's time and energy into what would be a limited revenue of just $3 million in 2013, plus a comparatively large commitment of capital, we felt it prudent to focus on the more scalable areas of our business. I am happy to discuss this more during Q&A. We ended 2012 with record organic and mobile traffic and we are optimistic that we can continue to build on those gains in 2013. We believe is 2013 is shaping up to be a great year for us with a forecast of our second highest adjusted net income ever and with a far more defensible blend of revenue and traffic."
Rank 500 for Google with a growth of 128% from 2007 - 2011
Meines Erachtens können die Shortseller aber anstellen, was sie auch wollen, sie sitzen in der Falle.
Deloitte's 2012 Technolgy Fast 500 Ranking
Rank 284 for Local Corp with a growth of 266% from 2007 - 2011
Rank 500 for Google with a growth of 128% from 2007 - 2011
That is a average during a period with a difficult year 2011 of 29.6%.
Turnaround of Local Corp [Adjusted Net income (loss) ]had take place:
FY-09: 3,041,000$
FY-10: 13,775,000$
FY-11: (1,734,000)$
FY-12: (600,000)$
FY-13: 5,000,000$
Wenn man sich einmal diese Reihe der Adjusted Net Incomes der letzten fünf Jahre ansieht, ist es schon ziemlich absurd, dass der criminal crime hinter der manipulieden Seite The Street Sweeper behauptet, dass man mit dem Geschäftsmodell von Local Corp nicht in die Gewinnzone kommen könne.
Fiscal 2013 Financial Guidance of Local Corp:
Revenue - The company expects 2013 revenue of between $93 million and $95 million, which at the mid-point, is an increase of 12 percent, over the fourth quarter 2012 exit run rate.
Adjusted Net Income – Adjusted Net Income for 2013 is expected to be at least $5 million, which would result in approximately $1 million in debt-free cash flow. The company defines debt-free cash flow as cash provided by operating activities, less capital expenditures
The guidance for Yelp's revenues in 2013 ist with 211 million only the 2.2-fold of the 94 million reveneus of Local Corp, but the market-cap of Yelp ist with 1,570 million the 43-fold of the idiotic low 36 million of Lcoal Corp.
Das ist eine Divergenz um den Faktor 20.
Local Corp development of Unique Visitors:
11/2012: 18,745,842 Monthly Unique Visitors
12/2012: 22,738,206 Monthly Unique Visitors
01/2013: 26,410,927 Monthly Unique Visitors
02/2013: 24,017,605 Monthly Unique Visitors
Decrease of 9.06% (February has only 28 days against 31 in January) against January and an increase of 38.64% year-over-year
Compare with the development of Yelp's Unique Visitors:
11/2012: 19,358,705 Monthly Unique Visitors
12/2012: 21,017,483 Monthly Unique Visitors
01/2013: 22,293,301 Monthly Unique Visitors
02/2013: 21,063,155 Monthly Unique Visitors
Decrease of 5.52% (February has only 28 days against 31 in January) against January and an increase of 12.66% year-over-year
Compare with the development of Google's Unique Visitors:
11/2012: 170,708,977 Monthly Unique Visitors
12/2012: 172,771,973 Monthly Unique Visitors
01/2013: 174,123,575 Monthly Unique Visitors
02/2013: 173,396,028 Monthly Unique Visitors
Decrease of 0.42% (February has only 28 days against 31 in January) against January and an increase of 10.73% year-over-year
Compare with the development of Zillow’s Unique Visitors:
11/2012: 10,978,144 Monthly Unique Visitors
12/2012: 11,366,564 Monthly Unique Visitors
01/2013: 14,298,071 Monthly Unique Visitors
02/2013: 13,415,496 Monthly Unique Visitors
Decrease of 6.17% (February has only 28 days against 31 in January) against January and an increase of 45.23% year-over-year
Compare with the development of ANGI’s Unique Visitors:
11/2012: 2,603,340 Monthly Unique Visitors
12/2012: 2,551,023 Monthly Unique Visitors
01/2013: 3,454,644 Monthly Unique Visitors
02/2013:3,185,928 Monthly Unique Visitors
Decrease of 7,78% (February has only 28 days against 31 in January) against January and an increase of 50,10% Y-o-Y
Compare with the development of Meetme’s Unique Visitors:
11/2012: 3,279,980 Monthly Unique Visitors
12/2012: 3,129,931 Monthly Unique Visitors
01/2013: 2,992,949 Monthly Unique Visitors
02/2013: 2,453,968 Monhly Unique Visitors
Compare with the development of Yahoos’s Unique Visitors:
11/2012: 161,959,555 Monthly Unique Visitors
12/2012: 163,582,176 Monthly Unique Visitors
01/2013: 164,827,887 Monthly Unique Visitors
02/2013: 163,723,320 Monthly Unique Visitors
Decrease of 0.67% (February has only 28 days against 31 in January) against January and an increase of 12.10% year-over-year
Du postest hier die wildesten Vergleiche zu den Unique Visitors. Für Yahoo z.B. ungefähr die 8-fache Zahl wie für Local, aha schaut ja schlimm aus wenn man die Börsenbewertung dazu vergleicht. Schaut man sich aber die Umsatzzahlen an, macht Yahoo aber den 50-fachen Umsatz gegenüber Local. Scheinbar generiert Yahoo 6x so viel Umsatz per Unique Visitor wie Local? Vom Vergleich des Gewinns und der Cash Position einmal ganz zu schweigen. Irgendwo scheint's da bei Local zu hapern. Ich kann mir vorstellen, dass es bei den anderen Werten mit denen du Local immer vergleichst, nicht anders aussieht.
http://finance.yahoo.com/q/ks?s=LOCM+Key+Statistics
http://finance.yahoo.com/q/ks?s=YHOO+Key+Statistics
Ich kenne das Problem mit aufgeblasenen Besucherzahlen von MyHammer. Das hilft gar nichts, wenn der Aufwand den Nutzen übersteigt. Dort hat man mittlerweile die Strategie grundlegend geändert, bei Local wird das meiner Meinung nach noch anstehen.
Grüße
JG
Optionen
| Boardmail an "JaminGottfried" |
Wertpapier: Local Corp |
Kann es sein, dass Local zum Ende 2012 nur noch 3,7 Mio Cash hatte und mit 10,4 Mio $ Anfang 2012 gestartet ist? Dass die Cash Position in Q4 nicht weiter zurückgegangen ist, lag auch nur daran, dass man Rovion verkauft hat, das operative Geschäft hatte in Q4 weiterhin negativen cash flow wenn ich das richtig sehe ...
"• Cash – The company’s cash balance was $3.7 million as of Dec. 31, 2012, unchanged from the Sept. 30, 2012, cash balance. During the fourth quarter 2012, the company had negative cash flow from operations offset by cash proceeds from the sale of Rovion’s assets and an additional draw on the line of credit. "
http://finance.yahoo.com/news/...eports-fourth-quarter-211500047.html
Wie schaut es da um Local aus, wenn in 2013 die Prognosen der Geschäftsleitung verfehlt werden und man weiter einen solchen Cashburn hat wie in 2012? Bist du dir sicher dass die Kursentwicklung nur an den bösen Shortsellern liegt, oder gibt es da nicht vielleicht einen realen Hintergrund? Könnte mir vorstellen, dass bei Local eine Kapitalerhöhung kommen kann. Ich beschäftige mich kaum mit Local, aber alleine 15 Min. googeln nach div. Zahlen machen nachdenklich was die Zukunft von Local angeht. Ich bin der Meinung dass sie nicht so rosarot ist, wie du hier darstellst.
Die Entwicklung der Cashbestände über die Quartale kann man hier gut nachverfolgen...
http://finance.yahoo.com/q/sec?s=LOCM+SEC+Filings
Ich wünsche dir und den Investierten viel Glück bei Local, ich glaube ihr könnt es brauchen!
Grüße
JG
Optionen
| Boardmail an "JaminGottfried" |
Wertpapier: Local Corp |
Könnte jetzt weiter auf LOCM Kritik ausüben, aber wie bereits
in zig anderen Posts vorher:
LOCM verdient kein Geld und hat kaum finanzielle Mittel zur Verfügung.
Wirklich treffend dargestellt. Respekt.
The Turnaround of Local Corp
Adjusted Net income (loss)
FY-09: 3,041,000$
FY-10: 13,775,000$
FY-11: (1,734,000)$
FY-12: (600,000)$
FY-13: 5,000,000$
Meines Erachtens können da die Investierten von Glück reden, dass sie Ihr Geld momentan nicht in anderen Unternehmen dieser Branche mit schlechteren Zukunftsaussichten stecken haben.
http://yahoo.brand.edgar-online.com/...fault.aspx%253fcik%253d1259550
Hat Local nicht auch schon 10 Mio $ einer Kreditlinie in Anspruch genommen? Waren das Ende 2010 nicht erst 7 Mio $? Sind da wirklich in den letzten zwei Jahren fast 13 Mio $ Cash verbrannt worden?
Ich stecke bei Local wie gesagt nicht im Detail, Libuda du kennst dich doch hier so gut aus, wo ist denn das ganze Cash und der Kredit hingekommen, wenn die Betriebsergebnisse so gut sind?
Gibt es nicht auch Kreditbedingungen, die Local einhalten muss, ansonsten kann der Verleiher den Kreditbetrag sofort fällig stellen? Was passiert dann mit Local?
Grüße
JG
Optionen
| Boardmail an "JaminGottfried" |
Wertpapier: Local Corp |
1 Nutzer wurde vom Verfasser von der Diskussion ausgeschlossen: tradeconto