Der Antizykliker-Thread
Ist schon ok, AL, aber warten wir erstmal EOD ab, bevor wir hier ein Fazit ziehen.
Auch das ist meist ein Kontraindikator ;-)
Um nicht gesperrt zu werden, verzichte ich auf Zahlenangaben, bei welchen Kursen Du die letzten 12 Male "die Rallye" ausgerufen hast.
Gib dir mal 'nen Ruck ;-))
Wann steigst du ein?
Ich tippe mal, bei 650 im SPX könntest du doch weich werden, odda.....
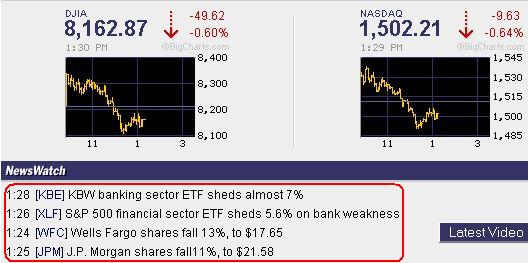
Eine Rallye ohne die Financials halte ich für nahezu ausgeschlossen.
Eher wird Obama über's WE zum Albino.
Angehängte Grafik:
screen_00411.jpg (verkleinert auf 96%)
screen_00411.jpg (verkleinert auf 96%)
Obama-Party kannst du übrigens vergessen. Sein Scheckbuch allerdings nicht...
Al, wir sollten nur mal erwähnen, dass du deine shorts auch schon geschmissen hast (nachzulesen im US-Bären-Fred). So sicher wie Du jetzt tust, warst Du Dir anscheinend auch nicht !?
Kannst mich gern berichtigen
Optionen
;o)
Angehängte Grafik:
sc.png (verkleinert auf 82%)
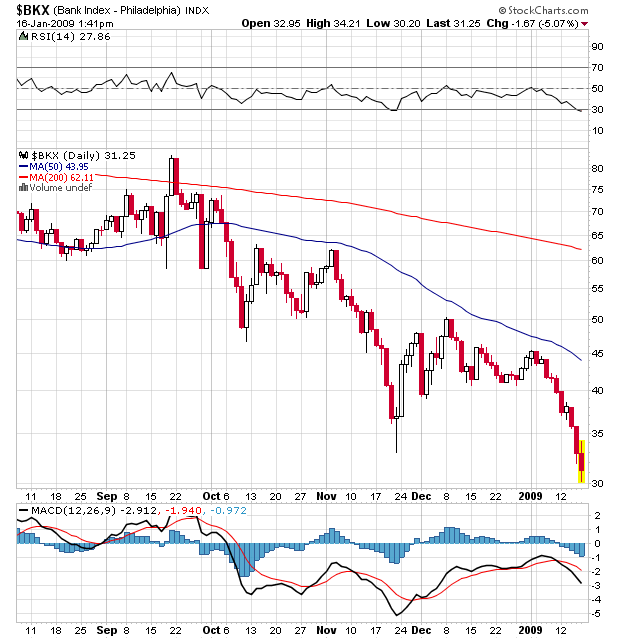
sc.png (verkleinert auf 82%)
Angehängte Grafik:
screen_00412.jpg
screen_00412.jpg
Als sich gegen Ende 2007/Beginn 2008 viele Protagonisten noch im 7.Börsenhimmel wähnten (ich denke dabei unwillkürlich an Thomas Grüner) und Kursziele a la DAX 10000, SPX 1700, etc. für 2008 heraushauten, empfahl Swenlin Anfang Januar 2008 klar und deutlich den Ausstieg aus Longs. Wer einem also mit so einer Empfehlung immense Verluste erspart hat, der bleibt bei mir wohlgelitten. Was nicht heißen soll, dass ich sämtliche Comments von C.Swenlin ungefragt übernehme, denn die perfekte Glaskugel besitzt auch er nicht. Gleichwohl waren viele seiner Analysen nicht nur in 2008 (hat die Zwischenerholungen auch gut getimt) ebenfalls recht trefflich.
Swenlin beziffert den aktuellen Fair Value des SPX wie folgt, und dies ist auch eine kleine Richtschnur für mich:
Based upon the latest GAAP earnings the following would be the approximate
S&P 500 values at the cardinal points of the normal historical value range.
They are calculated simply by multiplying the GAAP EPS by 10, 15, and 20:
Undervalued (SPX if P/E = 10): 460
Fair Value (SPX if P/E = 15): 689
Overvalued (SPX if P/E = 20): 919
Hier anbei noch mal die absolut zutreffende Analyse Swenlins aus dem Januar 2008, die sogar den Abstieg des SPX auf die 750 Punkte-Marke exakt voraussah:
On January 8 (2008) the 50-EMA crossed down through the 200-EMA on the S&P 500 daily chart, generating a long-term sell signal and declaring that we are now in a bear market. This was confirmed this week when the weekly 17-EMA crossed down through the 43-EMA.
An important point is that this long-term sell signal is not so much an action signal as it is an information signal. What this means is that we need to begin interpreting charts and indicators in the context of a bear market template. For example:
* Oversold conditions should be viewed as extremely dangerous. Whereas in bull markets oversold lows usually present buying opportunities, in bear markets they can often resolve into more heavy selling.
* Overbought conditions in a bear market are most likely to signal that a trading top is at hand.
* While bear market rallies present great profit opportunities, long positions should be managed as short-term only.
The questions remain as to how far down prices will go and how long the bear market will last? In the shorter term we have a minimum downside projection from the double top neckline of about 1160 on the S&P 500 Index. That could mark a medium-term low from which a bear market rally could rise. For the longer-term, let's look at the 4-Year Cycle chart below. As you can see, the last cycle low was in mid-2006, so the next projected low is in mid-2010. Assuming that the cycle low and bear market low will be the same, we have a long, bloody road ahead. The most obvious downside target is the support at the 2002 lows, about 750 on the S&P 500.
Die Analysen Swenlins aus der Vergangenheit sind hier einsehbar:
http://www.decisionpoint.com/ChartSpotliteFiles/ChartSpotMenu.html
Ich mach Schluss für heute. Morgen um 7 geht mein Flieger, die nächsten Postings kommen aus LA, CA. Wird auf jeden Fall weniger werden. Viel Spaß noch. Freu mich schon den Rest hier nachzulesen ;-))