T Bond
Seite 1 von 2 Neuester Beitrag: 23.02.24 13:15 | ||||
| Eröffnet am: | 17.01.23 23:58 | von: nicco_trader | Anzahl Beiträge: | 43 |
| Neuester Beitrag: | 23.02.24 13:15 | von: sebyv | Leser gesamt: | 15.317 |
| Forum: | Börse | Leser heute: | 3 | |
| Bewertet mit: | ||||
| Seite: < | 2 > | ||||
Auffällig ist, dass die T-Bonds heute steigen. Greift die FED ein?
When will the debt limit be breached?
Auszug
The United States is expected to hit its technical debt limit on Thursday. At that point, the Treasury Department will begin using “extraordinary measures” to continue paying the government’s obligations. Those are essentially fiscal accounting tools that curb certain government investments so that the bills continue to be paid.
Those options could be exhausted by June, Ms. Yellen told Congress last week. The Bipartisan Policy Center, which closely tracks the debt limit deadline, estimates that the Treasury will really run out of cash — what’s known as the X-date — sometime around the middle of the year.
How much debt does the United States have?
The national debt crossed $31 trillion for the first time last year. The borrowing cap is set at $31.381 trillion.
What happens if the debt limit is not lifted or suspended?
Once the government exhausts its extraordinary measures and runs out of cash, it would be unable to issue new debt. That means it would not have enough money to pay its bills, including interest and other payments it owes to bondholders, military salaries and benefits to retirees.
No one knows exactly what would happen if the United States gets to this point but the government could wind up defaulting on its debt if it is unable to make required payments to its bondholders. Economists and Wall Street analysts warn that such a scenario would be economically devastating and could plunge the globe into a financial crisis.
Can the government do anything to forestall disaster?
There is no official playbook for what Washington could — or would — do if the United States really was unable to pay its bills. But options do exist. The Treasury could try to prioritize payments, such as paying bond holders first. Still, such an idea has yet to be tested and would require political decisions about who gets paid and who doesn’t.
If the United States does default on its debt, which would rattle the markets, the Federal Reserve could theoretically step in to buy some of those Treasury bonds. That could help calm what would undoubtedly be panic in the Treasury markets and elsewhere.
mehr
https://www.nytimes.com/article/debt-ceiling-us-economy.html
Ich vermute, dass die FED eingreift. Dann ist ein Short zu riskant.
SL erreicht
SL erreicht
Angehängte Grafik:
t_bond_20230118.png (verkleinert auf 65%)
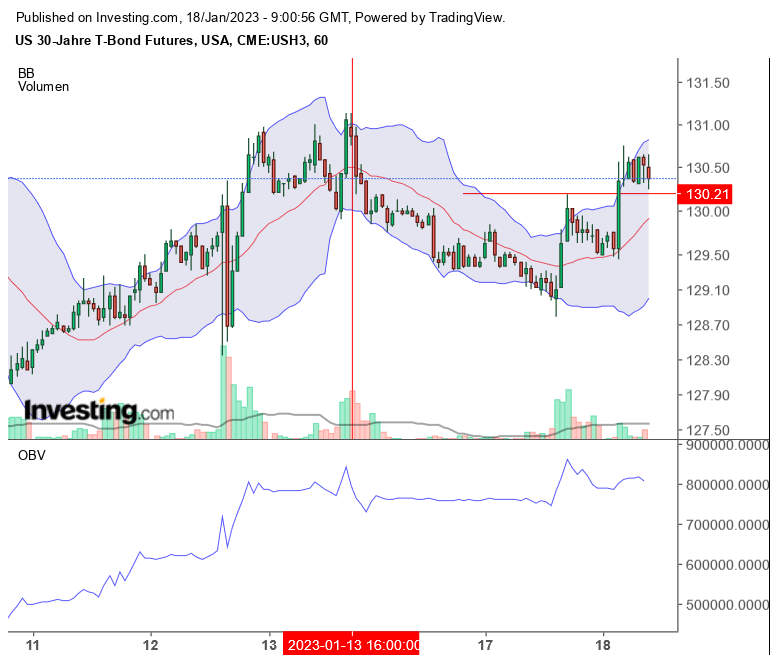
t_bond_20230118.png (verkleinert auf 65%)
FT
What happens when the US hits the debt ceiling?
https://www.ft.com/content/86cf26ec-757b-4d47-8a7c-4a557d6cf549
What happens when the US hits the debt ceiling?
https://www.ft.com/content/86cf26ec-757b-4d47-8a7c-4a557d6cf549
Angehängte Grafik:
tbond_20230119.png (verkleinert auf 65%)
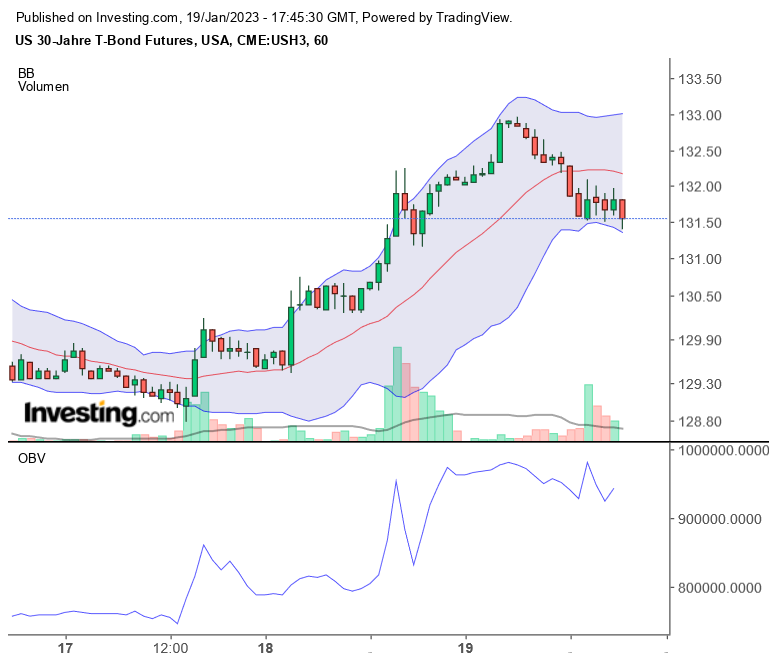
tbond_20230119.png (verkleinert auf 65%)
“Rates will probably be higher than 5%,” says @jpmorgan
CEO Jamie Dimon. “There’s still a lot of underlying inflation.”
https://twitter.com/i/status/1616038184583942147
CEO Jamie Dimon. “There’s still a lot of underlying inflation.”
https://twitter.com/i/status/1616038184583942147
Für den evtl. Fall einer Rezession.
SL rote Linie
SL rote Linie
Angehängte Grafik:
tbond_20230131.png (verkleinert auf 65%)
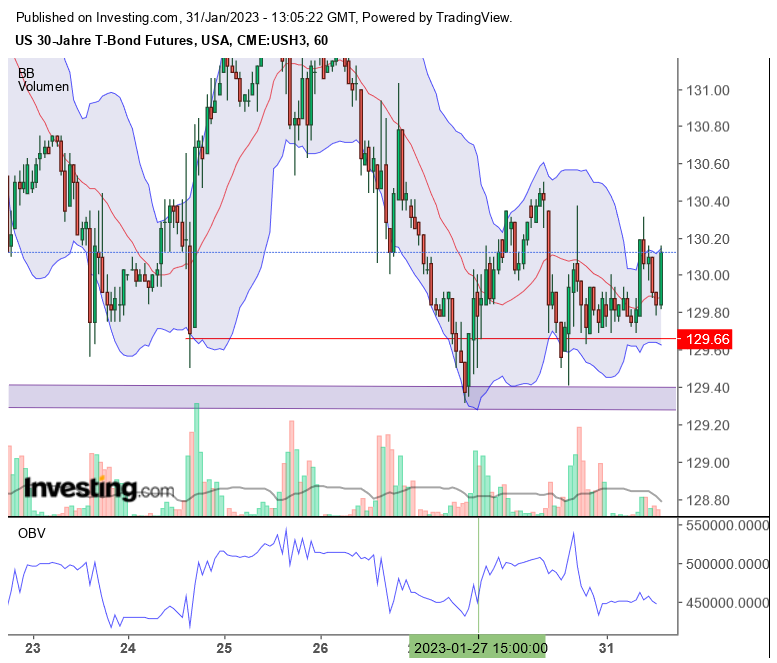
tbond_20230131.png (verkleinert auf 65%)
Für den T-Bond Future werden zurzeit bei investing.com keine Umsätze gezeigt.
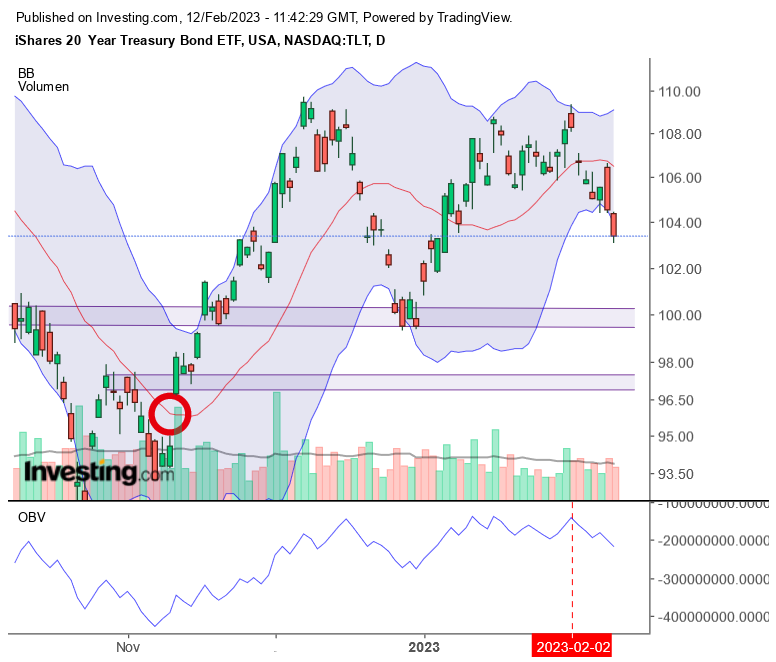
Alternative TLT, ETF US Anleihen + 20 J.
Alternative TLT, ETF US Anleihen + 20 J.
Angehängte Grafik:
tlt_20230203.png (verkleinert auf 65%)
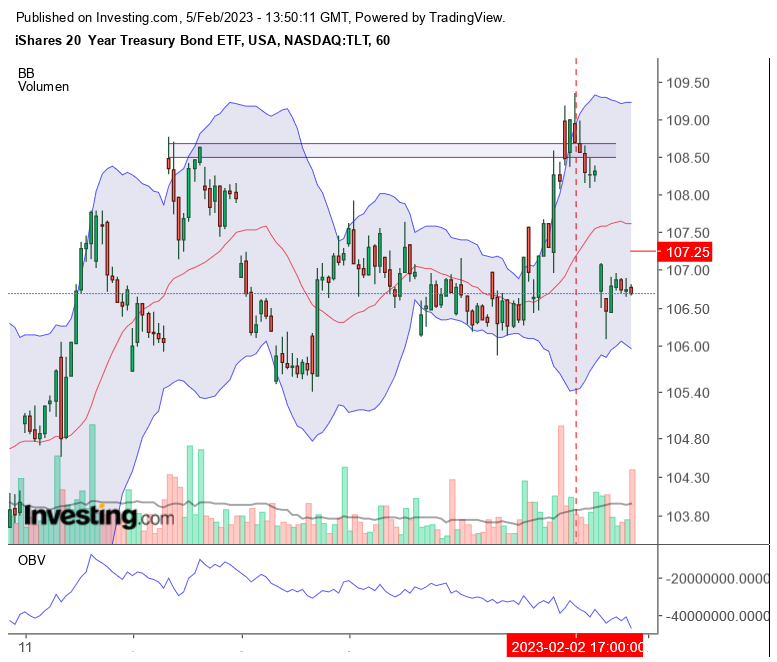
tlt_20230203.png (verkleinert auf 65%)
Sentiment Speaks: Time To Fight The Fed - Rates Are Going Lower In 2023
By Avi Gilburt , Feb 10, 2023
Auszug
"Now, I really cannot provide to you the same detail of analysis that I provide to the members of ElliottWaveTrader, yet I can provide to you larger degree parameters to follow in the coming weeks. Larger degree support is in the 98.50 region. And, as long as this pullback remains over support, and then takes out the high struck in early December, then that would likely be the signal that we are on our way to my first target in the TLT in the 120.50-125.50 region."
https://www.elliottwavetrader.net/p/analysis/...-202302108322938.html
"Larger degree support is in the 98.50 "
Unter 98,5 ist noch ein Gap.
Angehängte Grafik:
tlt_20230210.png (verkleinert auf 65%)
tlt_20230210.png (verkleinert auf 65%)
The next bull market in stocks won't kick off until the Fed is forced to bail out the US government, Bank of America says
"The US government currently has a debt pile of $31 trillion, and that's expected to soar by more than $20 trillion over the next 10 years. That's $5.2 billion every single day, or $218 million every single hour, Bank of America's Michael Hartnett said in a Friday note.
While the trillions of dollars of fiscal stimulus in the wake of the COVID-19 pandemic were successful in averting a recession over the past three years, that spending produced short-term gains that will eventually lead to long-term pain.
That's because the US government's rising debt pile and growing fiscal deficits will result in higher and higher interest payments as the Fed hikes rates, which influence the yields that must be paid on Treasury bonds.
For nearly two decades up until 2018, a combination of relatively small federal deficits and low interest rates meant that the US government was paying less than 1.5% of its GDP on payments tied to its debt. That figure has since jumped to 1.9%, and BofA hints that it will continue to rise.
"US Federal deficit up to 6.1% of GDP due to fiscal infrastructure spend; at peak of 2000 expansion, US ran fiscal surplus, peak of 2007 expansion deficit was 1% of GDP, peak of last expansion deficit was 2.5% of GDP," Hartnett said.
This represents a clear deterioration in trends that is going to be exacerbated by the eventual surge in debt-servicing payments, and that's where the Fed comes in.
Eventually, according to Hartnett, the Fed will be forced to resort to yield curve control, similar to the Bank of Japan, to "bail out the US government" and help lessen the burden of its surging interest payments.
Yield curve control is a form of monetary policy in which a central bank's bond purchases target long-term maturities to control long-term rates. That contrasts with typical quantitative easing programs in which central banks seek to influence short-term rates.
"And that's when the next great bull market in risk begins," Hartnett said.
https://markets.businessinsider.com/news/stocks/...nment-rates-2023-2
Not All New Highs Are Bullish
Annual data shows that the Federal government’s cost to service its debt (as a % of GDP) reached its highest level in two decades last year.
Why It Matters: Debt servicing costs were at a generational low just a few years ago. Now persistent inflation is pushing bond yields higher and the latest CBO projections show federal debt levels continuing to soar (new highs that aren’t cause for celebration). Interest payments on the debt are moving from afterthought to fiscal burden. Without a rediscovery of fiscal discipline getting a handle on inflation is going to be a challenge and that is likely to keep yields higher for longer. A quick return to the market and fiscal conditions of the past decade does not appear to be in the cards.
https://allstarcharts.com/plus-weekly-observations_02-24-2023/
Angehängte Grafik:
us_interestpayment_percent_gdp.png (verkleinert auf 35%)

us_interestpayment_percent_gdp.png (verkleinert auf 35%)