Goldpreis-Szenarien
Seite 1 von 2 Neuester Beitrag: 24.04.21 23:51 | ||||
| Eröffnet am: | 09.08.06 19:17 | von: permanent | Anzahl Beiträge: | 46 |
| Neuester Beitrag: | 24.04.21 23:51 | von: Vanessachjia | Leser gesamt: | 20.263 |
| Forum: | Börse | Leser heute: | 3 | |
| Bewertet mit: | ||||
| Seite: < | 2 > | ||||
Goldpreis-Szenarien
Veröffentlich am 09.08.2006 11:40 Uhr von Walter K. Eichelburg
Von verschiedenen Autoren werden unterschiedliche Szenarien für die zukünftige Goldpreis-Entwicklung angegeben. Wie sich das real abspielen wird ist heute noch nicht ganz klar, aber von enormer Wichtigkeit für alle Edelmetall-Investoren. Ich möchte in diesem Artikel auf die wichtigsten Szenarien eingehen und sie bewerten.
1. Deflationisten (Prechter, Hannich)
 Die Deflationisten sehen den Goldpreis bei einem Crash des Finanzsystems drastisch sinken, da alle Assets verkauft werden müssen, um Cash zu generieren. Erst später soll der Goldpreis in einer Hyperinflation massiv ansteigen.
Es spricht einiges dafür, dass der Goldpreis in einer Liquditätskrise wie im Mai/Juni 2006 mit allen anderen Assets (Aktien, Commodities) einbricht, da die Fonds und Spekulanten nicht zwischen den Assets unterscheiden. Nach Robert Prechter (Buch: Conquer the Crash) könnte der Goldpreis auf 200 $/oz sinken. Laut Robert Prechter’s Elliot Wave Financial Forecast (EWFF) vom August 2006 soll der Goldpreis auf 450 $/oz sinken. Nach einer längeren Deflationsphase soll der Goldpreis in einer nachfolgenden Hyperinflation (nach mehreren Jahren) dann massiv steigen. Herr Hannich gibt überhaupt keinen Richtwert an, jedoch lehnt er aus idelologischen Gründen Gold generell ab.
Das Problem mit den Deflationisten ist, dass sie die "reine Deflation" aus den Zeiten des Goldstandards vor Augen haben. Im Fiat Money-System dagegen führt ein Abverkauf der Assets (= Deflation der Aktien & Bonds) auch zu einem Abverkauf der betroffenen Währung. Es ist unwahrscheinlich, dass bei einem massiven Abverkauf von US-Bonds und Aktien der Dollar nicht auch verkauft wird. Es ist sichtbar, dass die US-Wirtschaft derzeit in eine Depression geht. Der Immobilienmarkt kollabiert, Einzelhandel und Tourismus brechen ein. Die Frage ist nur, welche Art von Depression es sein wird.
Modifizierte Deflationisten wie Martin Weiss sehen daher, dass in diesem Fall der Goldpreis "durch die Decke" geht, besonders, wenn es den US-Dollar trifft.
Verhalten für Anleger: Bei diesem Szenario empfiehlt es sich, mit Einsetzen der Krise in Bargeld und kurzlaufende Staatsanleihen zu gehen. Mit ansteigendem Goldpreis ist dann ein sofortiger Umstieg in Gold und Silber erforderlich, denn dann geht der Rest der Papierwelt durch Hyperinflation zu Grunde.
2. Gold verschwindet (Laird, Tiggemann)
 Diese Autoren sehen, dass im Fall einer Finanzkrise Gold und Silber einfach nicht mehr zu bekommen sind, egal um welchen Preis. Chris Laird meint etwa in "Final Days of US-Dollar?", dass im Fall eines massiven Dollar-Abverkaufs von den USA Devisenkontrollen verhängt werden, was dazu führt, dass Gold zu keinem Preis mehr ausreichend zu bekommen ist. Friedrich Tiggemann meint, dass das derzeitige Finanzsystem so extrem angespannt ist, dass ein Auslöser wie eine Großpleite, Terroranschlag, etc. für den sofortigen Totalzusammenbruch genügt und dann Gold innerhalb weniger Wochen nicht mehr zu bekommen ist. Viel spricht für diese These.
Begründung: Die in der Welt umlaufenden Papier-Finanzwerte sind derartig groß und die Gold & Silbermenge nur ein Bruchteil davon. Studien zeigen, dass erst bei einem Goldpreis von etwa 50.000 $/oz ein annäherndes Gleichgewicht gefunden wird.
Verschwindet durch ein Ereignis das Vertrauen in die Papierwerte und besonders in den US-Dollar wird eine gewaltige Flucht zuerst der Großanleger und Zentralbanken in das Gold stattfinden. Es gilt das alte Prinzip: den Letzten beißen die Hunde.
Verhalten für Anleger: Sollte dieses Szenario zum Tragen kommen, muss man bereits in physischem Gold und Silber drinnen sein, denn wenn die Krise beginnt, hat man kaum mehr eine Chance, hineinzukommen. Besonders dann, wenn Staaten wie die USA Devisenkontrollen verhängen, womit die Dollar-Wertpapiere praktisch wertlos werden. Der Politik ist in einem solchen Fall alles zuzutrauen.
3. Exponentieller, stetiger Anstieg (Hommel)
 Jason Hommel hat ein Szenario mit einem einigermaßen exponentiellen, stetigen Anstieg entworfen. Ihm ging es mehr darum den endgültigen Höhepunkt des Goldpreises zu berechnen, als um einen zeitlichen Verlauf anzugeben. Ein solch „linearer“ Anstieg wird sicher nicht vorkommen.
In "Future Gold and Silver Prices" zeigt Jason Hommel diese linear exponentielle Extrapolation (Bild rechts).
Der Endpreis von etwa 50.000 $/oz ist realistisch, jedoch sicher nicht ein solcher Verlauf. Der Goldpreis-Anstieg wird wie bisher volatil und mit Einbrüchen und Spikes geschehen.
Verhalten für Anleger: Dieser Verlauf wäre der Einfachste, da man eigentlich nur das Ende des Anstiegs im Auge halten muss.
4. Modifiziertes 1970er Szenario (verschiedene Autoren)
In diesem Szenario gibt es einen Commodity- und Goldpreisanstieg wie Ende der 1970er Jahre, mit dem Unterschied, dass das Finanzsystem nicht mehr gerettet werden kann, d.h. der Goldpreis steigt massiv weiter und es kommt zum Zusammenbruch.
 Wir sind in der Tat heute in einer ähnlichen Situation wie Ende der 1970er Jahre: massive reale Inflation, die inzwischen über die Energiepreise in alle anderen Preise geht, künstlich negative reale Zinsen. Inzwischen bricht überall in der Welt die Inflation aus den Rohstoffen und Energie in die Konsumgüter durch. Das Resultat ist, dass jetzt die Zinsen überall steigen müssen. Der massive Goldpreis-Ansteig seit Mitte 2005 ist ein Alarmzeichen. In der Tat konnte man in dieser Zeit mit Gold und anderen Rohstoffen mehr verdienen, als mit jeglicher Art von Schuld-Geldanlage (Sparbücher, Anleihen). Sagen Sie Ihrer Bank, dass Sie jetzt 10% Zinsen haben möchten, um die reale Konsumentenpreis-Inflationsrate von etwa 6% abzudecken. Noch besser, sagen Sie der Bank, dass Sie jetzt 25% Zinsen auf ihre Spareinlagen haben möchten, denn das sichere Gold bringt Ihnen mehr. Heute wird man Sie noch auslachen, aber nicht ewig.
Die Zentralbanken werden versuchen, die Zinsen solange untenzuhalten, bis die derzeitigen Methoden der Goldpreisdrückung endgültig versagen. Dass kann noch 2006 passieren. Die Entladung in den Goldpreis wird dann viel heftiger ausfallen, besonders wenn noch massenhaft Kreditausfälle dazukommen. Angst und Gier werden sich dann zusammen im Goldmarkt entladen, eine besonders starke Kombination.
Verhalten für Anleger: Sollte dieses Szenario zum Tragen kommen, sollte man bereits in physischem Gold und Silber drinnen sein, denn wenn die Krise richtig beginnt, kommt man nur zu einem viel höheren Preis hinein. Es wird wie bisher Korrekturen geben, jedoch sollte man keinesfalls "traden" (laufend hinein- und herausgehen). Am Besten einsteigen und drinnen bleiben. Es gilt dann das alte Sprichwort: "man verdient mehr, wenn man schläft".
Wahrscheinliche Entwicklung
Welches dieser Szenarien nun wirklich eintritt, ist derzeit (Juli 2006) nur recht schwierig vorauszusagen:
1.) Deflationsten-Szenario
Es ist unrealistisch, dass der Goldpreis bei einer deflationären Depresssion lange unten bleibt, da dann der Dollar wegen Kreditausfällen massiv abverkauft wird.
2.) Schneller Zusammenbruch, Gold verschwindet
Ist relativ realistisch, wenn man bedenkt, dass die US-Kriege im Irak und Libanon (Stellvertreterkrieg) verloren sind und ein massiver Dollar-Abverkauf jeden Tag kommen kann.
3.) Exponentieller stetiger Anstieg über lange Zeit
Dieses Szenario ist am wenigsten realistisch.
4.) Modifiziertes 1970er Jahre Szenario
Denn erst der steigende Goldpreis und der Abverkauf der Papier-Währungen, speziell des US-Dollars wird die Zentralbanken zwingen, die Zinsen anzuheben - wie in den 70er Jahren. Diese massiv steigenden Zinsen werden dann zu den Kredit- und Bondausfällen führen, was die Flucht noch mehr verstärkt. Es ist notwendig zu wissen, dass die Methode von 1979/80 mit hohen Zinsen heute das System nicht mehr retten kann. Die Geld-/Vermögens-Volumen sind heute aber um das 30 fache größer.
Silber
Silber wird insgesamt eine bessere Performance bringen als Gold. Mit einem Gold:Silber Verhältnis von 10:1 oder besser ist vorübergehend zu rechnen. Im Fall eines deflationären Einbruchs wird aber der Silberpreis weiter hinuntergehen als der Goldpreis. Dies deshalb, weil Gold das primäre monetäre Metall ist. Silber wird aber nachziehen.
Minen-Aktien
Gold- und Silberminen-Aktien haben gegenüber dem Metall einen Hebeleffekt von ungefähr 3:1. Das heißt, dass Minen-Aktien wahrscheinlich eine höhere Performance erzielen werden, als das Metall. Jedoch sind diese Aktien gegenüber dem physischen Metall in eigenem Besitz mit einer Reihe von Nachteilen behaftet. Nur Experten sollten darin investieren:
- sie sind Papier und vom Funktioneren des Finanzsystems und der Börsen abhängig, sowie der Möglichkeit ausländische Wertpapiere zu halten (Devisenkontrollen)
- die Minen selbst können verstaatlicht werden - geschieht derzeit in Südamerika
- besonders Junior-Explorers sind hoch riskant, da eventuell nichts gefunden wird oder keine produzierende Mine errichtet werden kann
- man muss sich in Geologie, bei der Beurteilung von Firmen und Management (Due Dilligence) und der politischen Risiken auskennen.
Gold/Silber-Zertifikate
Diese sind praktisch, da elektronisch und nicht mit schwerem Metall behaftet. Jedoch sind sie ein reines Versprechen der ausgebenden Bank. Wenn diese untergeht oder die Einlösung (ohnehin nur gegen Geld) einstellt, werden sie wertlos. Zertifikate ist die gefährlichste Form, daher Finger weg davon!
Zusammenfassung
Ich habe hier einige, in der Literatur vorkommende Szenarien für den zukünftigen Goldpreis-Anstieg dargelegt. Das 1970er Jahre Szenario ist dabei das wahrscheinlichste.
Man sollte daher den derzeit gedrückten Gold- und Silberpreis benützen, um einzusteigen, bzw. aufzustocken. Hier ist noch ein schönes Doomsday-Szenario von Chris Laird: "Dark New Day". Das Szenario ist teilweise auch für Europa anzuwenden, denn wenn der US-Dollar abstürzt, ist es auch um die anderen Währungen geschehen, denn diese sind alle Derivate des US-Dollars. Allerdings erwarte ich den "Event" wesentlich schneller. Protect Yourself!
Doug Casey, einer der besten Investoren der Welt in seinem International Speculator Newletter vom August 2006 zum US-Dollar:
Foreign owners of the big green mountain of U.S. dollars have become uneasy and generally are looking to sell. There’s no dumping, at least not yet. When it comes, the flight from the dollar will start slowly, then gain momentum before moving into a blow-off. Like a glacier sliding toward a cliff, movement that seems inevitable may take a puzzlingly long time to get underway. But once it does, things speed up at a surprising rate. Most of what happens happens rapidly, toward the end of the process.
If the U.S. dollar is going to fall in purchasing power, you might assume that competing currencies will rise against the dollar. That assumption may not be a safe one, given that the U.S. dollar makes up such a large part of the reserves of so many countries, and because all modern currencies are nothing more than paper and hope. The euro, which many see as the "not-the-dollar" bet, is in some ways even worse off than the dollar: not only does nothing back it up, but no one does, either. It’s the test tube baby of monies. While we believe that gold is the only workable alternative currency and that it will continue to regain its place as money in the global financial system, there are sure to be trading opportunities in other fiat currencies as the U.S. dollar comes under pressure.
Übersetzung: Fremde Besitzer des großen, grünen Bergs von US-Dollars fühlen sich nicht mehr wohl damit und suchen nach Möglichkeiten, diese zu verkaufen. Derzeit gibt es noch keinen großen Abverkauf - noch nicht. Aber wenn er kommt, wird die Flucht aus dem Dollar langsam starten, dann immer schneller werden und dann in eine regelrechte Fluchtbewegung eintreten. Wie ein Gletscher, der sich auf eine Klippe zubewegt, kann es sehr lange dauern bis es richtig losgeht. Aber wenn er richtig fließt, dann schnell. Die meiste Bewegung wird es gegen Ende des Prozesses geben.
Wenn der Dollar fällt, könnte man annehmen, dass andere Währungen gegenüber dem Dollar steigen. Diese Annahme muss nicht richtig sein, denn der Dollar macht den Großteil der Währungsreserven der meisten Länder aus. Außerdem sind alle Währungen der Welt nicht viel mehr als Papier und Hoffnung. Der Euro, auch von manchen als "Anti-Dollar" gesehen, sieht in manchen Kriterien noch schlechter als der Dollar aus: nicht nur ist nichts dahinter, es steht auch niemand hinter dem Euro. Er ist eine "Probe-Währung". Daher glauben wir, dass Gold die einzige wirklich brauchbare Alternativ-Währung ist und es wieder seinen Platz als Geld im globalen Finanzsystem einnehmen wird. Es wird aber "Trading"-Gelegenheiten in anderen Fiat-Währungen geben, wenn der Dollar unter Druck kommt.
Weise Worte. So ist die Realität, Im April 2006 hat die Flucht aus dem Dollar in das Gold bereits begonnen, wurde aber noch einmal gestoppt. Nicht umsonst stützen derzeit alle anderen Währungen den US-Dollar. Also werden sie mit ihm gemeinsam zur Hölle fahren. Wie es 1979 begonnen hat.
Daher ist das 1970er Jahre Szenario wahrscheinlich das Realistischeste.
© Walter K. Eichelburg
walter@eichelburg.com, www.hartgeld.com
Warum?
- Gold ist in Dollar notiert, der Goldanstieg kann mit dem Dollarverfall nicht so richtig mithalten
- die industrielle Bedeutung von Gold ist unbedeutend, 75% gehen in die Schmuckindustrie, welche modeabhängig ist (mal ist Gold in, mal out)
- viele Notenbanken sitzen auf ihrem vielen Gold, es wirft aber kaum Zinsen ab - also was tun mit dem Zeug?
- Gold wurde die letzten 2 Jahre mächtig gepusht, ohne dass tatsächliche ökonomische Gründe (wie z.B. beim Öl) dahinterstehen; deswegen sind vermutlich viele zittrige HÄnde im Markt und viele Posis unter Wasser
Optionen
Begründungen sind hinlänglich bekannt.
Das Szenario 4 ist nach meiner Auffassung im Übrigen nicht abwegig. Ich glaube nicht an die große Weltfinanzkris, schließe sie eine Solche in meinen Überlegungen aber auch nicht grundsätzlich aus.
Wahrscheinlich erscheint mir hingegen der schleichende Vertrauensverlust in FIAT Money. Jeder druckt Geld ohne vernünftige Gegenwerte zu haben, Staatschulden können nur mit neuen Schulden bedient werden. Ein solches System funktioniert nie ewig, ein Neuanfang zum Vertrauensaufbau geschah in der Vergangenheit immer mit der Unterlegung von Edelmetallen.
Gruß
permanent
Optionen
Vollkommen richtig. Die Unterlegung oder Garantie einer Währung durch Edelmetalle ist nicht zeitgemäß und paßt auch nicht zu einer moderen Volkswirtschaft. Die Geldpolitik muß durch die Steuerung der Geldmenge das Wirtschaftswachtum finanzieren oder gar stimulieren. Das ist mit einem Goldstandard schlichtweg nich flexibel möglich.
Folgendes schrieb ich in diesem Thread:
http://www.ariva.de/board/264043?search_id=permanent&search_full=
Schlussfolgerung:
Wir werden in den nächsten Jahren einen Rückgang der amerikanischen Wachstumsraten sehen, möglicherweise sogar eine Rezession. Die Übertreibungen am Immobilienmarkt haben bei Weitem nicht die Ausmaße wie im Japan der 80er Jahre. Dennoch wird ein stärkerer Preisrückgang am Immobilienmarkt die amerikanischen Privathaushalte stark belasten, einen Konsumrückgang herbeiführen, die Aktien- und Rentenmärkte fallen lassen. Auch an einer stärkeren Abwertung der US Währung führt mittelfristig kein Weg vorbei.
Das Außenhandeldefizit überflutet die Welt mit Dollar. China wird zum Ende diesen Jahres über Dollarreserven (in der Hauptsache US Bonds) von einer Billionen Dollar verfügen. Irgendwann werden auch die Chinesen keine Lust mehr haben den US Konsum zu finanzieren. Eine Abkehr von dieser Politik wird nach Auffassung der meisten Wirtschaftsexperten nicht vor den Olympischen Spielen 2008 zur erwarten sein. Denn China betreibt diese Politik sicher nicht aus Nächstenliebe. Der Aufbau der überdimensionierten Produktionsanlagen (Anlageinvestitionen werden in diesem Jahr 50% des chinesischen BIP erreichen) sucht weltweit Abnehmer, somit wird der Zusammenbruch des US Konsum die Chinesen ebenso hart treffen.
Das System wird nicht zusammenbrechen, doch was bedeutet es für die USA, Bonds an Ausländer begeben zu haben. Man schuldet der Welt US Dollar! Wer hat die Gewalt über die Produktion des US Dollar? Wer bestimmt die Menge der ausgegebenen US Dollar?
Die USA schulden der Welt so gesehen buntes bedrucktes Papier. Eigentlich nicht schlimm oder?
Irgendwann will man für seine eingelagerten Währungsreserven Gegenleistungen sehen, irgendwann wird das Vertrauen in eine Währung schwinden und dann kommt für eine Übergangsphase Gold wieder seinen Glanz.
Für Silber bin ich allerdings weitaus optimistischer:
Angebot Nachfrage Situation vorteilhafter,
Industrieller Verbrauch.
Gruß
Permanent
Die Société Générale hat ein neues Gold und Silber Bonus-Zertifikat aufgelegt, welches sich zu jeweils 50% auf den Goldman Sachs Gold Excess Return Index sowie den Goldman Sachs Silber Excess Return Index bezieht. Das Produkt befindet sich noch bis einschließlich 25. August 2006 in der Zeichnung
Download Flyer
Die Goldman Sachs Gold und Silber Excess Return Indizes bieten eine attraktive Möglichkeit, an der zukünftigen Entwicklung der beiden Edelmetalle zu partizipieren. Die Indizes beziehen sich auf den kürzestlaufenden Futurekontrakt des jeweiligen Rohstoffs und ermöglichen so dem Anleger ein Investment in Gold und Silber ganz ohne Lagerkosten, wie sie beim physischen Erwerb anfallen würden.
Durch die attraktive Struktur des neuen SG Gold und Silber Bonus-Zertifikates hat der Anleger neben einer 100-prozentigen Partizipation an Kurssteigerungen der beiden Edelmetalle noch den Anspruch auf eine Bonuszahlung in der Höhe von 135 - 145 Prozent*, sofern der Indexkorb während der Laufzeit die Barriere bei 60 Prozent des Ausgangsniveaus nicht unterschreitet.
Eckdaten:
§
Emittent: SGE, Société Générale Effekten GmbH
Garantin: Société Générale (Moody's Aa2, S&P AA-)
Emissionspreis: 101 EUR (inkl. 1 EUR Ausgabeaufschlag)
Zeichnungsfrist: 07.08. - 25.08.2006
Emissionstag: 01.09.2006
Erster Bewertungstag: 25.08.2006
Basiswert: Korb aus je 50% GS Gold Excess Return Index
und GS Silber Excess Return Index
Finaler Bewertungstag: 25.08.2006
Fälligkeit: 02.09.2011
Bonuslevel: 135 - 145%*
Barriere: 60%
WKN: SG9B4J
* endgültige Festlegung am ersten Bewertungstag
Stand: 23.08.2006
Optionen

| Ignacio Merino 636 Santa Cruz Miaflores, Peru Phone: 001-51-56-973-5599 001-51-19-280-8796 Email: ebo@dowtheoryanalysis.com Website: www.dowtheoryanalysis.com | The Gold Report The Silver Bullet |
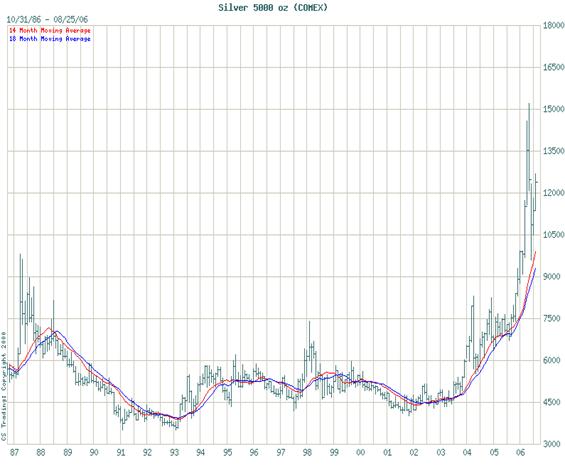
Silver is like the relative that no one wants to invite over to their house, and if you do, it's only on Christmas so your conscious doesn't bother you. You know the one I'm talking about; his clothes went out of style in the 50's and he doesn't smell too good either. Silver is also a bit of an enigma. A search through the dozens of articles on any of the better known websites for gold bugs will see it referred to as an industrial metal, a precious metal, or money. There are a lot of people in the first camp, more every day in the second camp, and almost no one in the last camp. For those of you who do subscribe to the "silver is money" hypothesis, keep the home fires burning because you will eventually have visitors. Through out the late 1980's, and for the entire decade of the 1990's, silver was definitely one thing: it was a poor investment as the price spent most of its time between $4.00 and $6.00 . That's just 1/10th of the all-time high registered in 1981. As a result, a strong case could have been made for silver as an industrial metal and you probably wouldn't have gotten any argument out of me.
With the new millennium came new opportunities, and with these opportunities came new life for the previously defunct white metal. As you can see in the historical chart for silver below, it made a significant bottom in 2001 at $4.03. As is typically the case, the bottom was followed by a prolonged period of consolidation. This in turn was followed by fits and starts that included a run to a 2004 high of $8.21. That surge sucked a lot of investors in who believed that they were on there way to $50.00 silver sooner rather than later. They were quite wrong as they found themselves back at $5.60 two months later. There was one difference though as silver then rallied to the $6.50 - $7.50 range before undergoing a significant consolidation. Better yet, silver built a huge base that would eventually be used to test significant resistance at the $14.81 level. This first test proved to be a bit much and the price then fell back to $9.55. On Friday, August 25th, silver closed at 1237.0 bases the September 06 futures contract on Friday.
Before discussing present conditions, I would like to take a look at the supply/demand issues that affect price. As I see them, they are as follows:
- Demand currently outpaces supply be minimum of 3% a year,
- A lot of mines were forced to close in the 1990's and at best it will be several years before that source is replaced,
- There are new demands in medicine, solar power, computer technology, and telecommunications, to name a few, for silver.
- The new silver ETF's are taking silver off the market and out of circulation,
- Unlike gold, some silver is "consumed" and therefore forever removed from circulation, and
- Increased demand in the jewelry business as silver is once again viewed as a precious metal.
With respect to jewelry demand, Peru is one of the largest producers of silver in the world yet it was unheard of to see silver pieces in a fine jewelry store two years ago. Now they can't get hold of enough to satisfy customer demand.
Given everything that is mentioned above, the long term outlook for silver is bright. Then you begin to factor in other political and economic issues like the Middle East question and the overall health of the U.S. economy and you can't help but get ex-
cited about the white metal's future. Whether you believe inflation stagflation or deflation is in the cards for the U.S., the end result will be the same, higher silver prices. The only difference will be 'timing'!
For purposes of our analysis, I am going to assume that stagflation is in the pipeline although most of my clients know that I was firmly entrenched in the deflationist camp for several years. I'll admit that I still do a bit of mental fence-sitting from time to time. There is no question in my mind the U.S. economy is slowing and that prices have increase significantly over the last five years. Even Helen Keller could see that in an historical chart of the CRB Index. Given the existence of a huge demand for raw materials in China, India, and the rest of Asia, I can only assume that prices will continue to increase. Hence we've met the true definition for stagflation; rising prices in a slowing economy. Silver will reap the benefits on both fronts. As a commodity its boat will float along with the CRB, and as a precious metal its sensitivity to inflation will make it the leader of the pack (along with gold).
I am quite focused on the long term, and much to the amazement and chagrin of my clients, pay little attention to the short term. I do understand the fundamentals of human nature though, and in an effort to appease, would like to expound on where I see silver going in the coming months. Below you'll see a Daily Chart of silver:
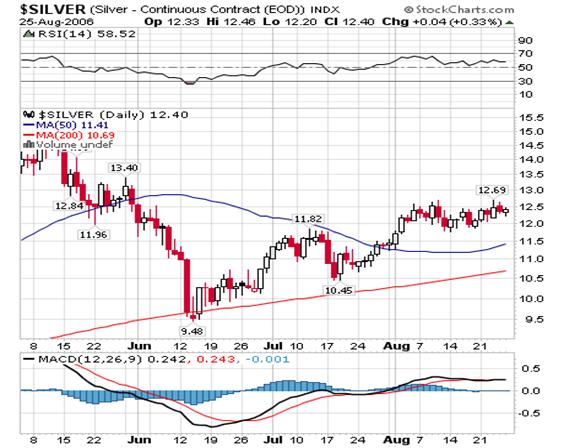
I think it's quite a bullish picture and here's why. You can see the June 14th low at $9.48 followed by an initial rally that topped out at $11.82. That rally was then followed by a correction that produced a higher low at $10.45. Higher lows are good and the higher high at $12.65 produced by the second leg up is even better. What really tickles my fancy though is the way silver has managed to consolidate above the first high of $11.82. I see that as a very positive development. I suspect we'll continue to consolidate at or just above the old high for two very good reasons:
- There is very good Fibonacci support at $11.69 basis the September contract, and
- The 50-dma also lends good support at $11.49.
Throw into the RSI which recently turned up along with the 50-dma and you have further reason to believe we are on the verge of a significant rally. If I am wrong, I risk a trip down to the 50-wma at $10.20 which has held firm for more than 20 months.
CONCLUSION
I expect silver to really take off in September, and at the very least test good resistance at $14.81. Furthermore, I expect it surpass this level and more than likely reach $20.73 by March 2007. There are a number of pivot points along the way which the average investor can use to gauge the white metal's progress. The first and foremost is $12.37 and the second is $13.03 (both are based on the September 2006 futures contract). Then of course we have the $14.81 Fibonacci resistance level. Once these two initial pivot points are out of the way, silver should really be off to the races. Meanwhile we consolidate. The only real impediment would be the presence of deflation. That would delay the process, but it would not alter the final outcome. Why? Because silver, like gold, is destined to become money! This transformation is a long process, but it is irreversible. The only question is when.
Enrico Orlandini
Dow Theory Analysis SAC
Lima, Peru
28 August 2006
1 All prices are "spot" prices unless otherwise stated.
|


Gruß
Permanent
The Shanghai Gold Exchange plans to launch silver trading before October 31, the exchange announced Thursday.
//-->Friday, October 20, 2006
The Shanghai Gold Exchange plans to launch silver trading before October 31, the exchange announced Thursday.
The move will allow domestic firms to trade the metal amid growing silver consumption in China.
The launch, driven by Beijing's effort to liberalize the bullion market, may attract small-cap investors to China's precious metals trade due to silver's lower price, traders said.
The international silver price has gained 34 percent this year, mainly on expectations of a boost in demand for the metal, which is used in jewelry, photography and dentistry. The metal hit a 25-year high at US$15.17 (HK$118.32) an ounce in mid-May.
"There will be a number of participants in the silver trade due to the metal's relatively low price compared with other precious metals, and its wide fluctuation this year," said Cai Zhenwei, a precious metal trader at the Bank of China in Shanghai.
The Shanghai Gold Exchange will begin trial trading on October 30, the exchange's fourth anniversary, the exchange said.
"With the expansion of the exchange's trading volume, the exchange thinks the time is ripe for launching the silver trade," it said.
The exchange now trades gold of 99.95 and 99.99 percent purity, a 50-gram contract, two forward gold contracts and a platinum contract.
The exchange will trade silver of 99.9 percent purity for one spot contract and one forward contract, it said.
The daily trading limit for the two contracts is 7 percent, compared to the settlement prices of the last trading day.
Evening trading will occur between 8.30pm and 11pm, dovetailing with daylight hours in London and New York.
REUTERS
Vorübergehende Vertrauenskrisen des Dollar nutzen und US-Aktien kaufen; wenn das überhaupt möglich ist. Dann den ca. 5Jahre-Aufschwung abwarten
Dann könnte man in Gold einsteigen.
Also als Wichtigstes: bloß nich das Vertrauen in den größten Marktplatz Nordamerika und den größten pazifischen player verlieren.
Gruß
Permanent
Wie gesagt, ein Thema, über das es leider inopportun ist zu reden. Aber ich glaube, daß es wichtig ist.
Inflation, Manipulation, and Long-Term Market Trends | ||||
|
Below is a slightly modified extract from a commentary originally posted at www.speculative-investor.com on 22nd October 2006.
Paul Volcker is often given credit for ending the inflation that ravaged the US economy during the 1970s, and yet the following chart shows that there was a sharp INCREASE in the year-over-year M2 growth rate (the inflation rate) during the first 4 years of his tenure as Fed Chairman. It's therefore not true that Volcker ended the inflation, which begs the question: why is he generally given credit for doing so?

Volcker is widely heralded as the man who defeated inflation because during his first 12 months as Fed chairman the main focus of inflation began to shift from physical assets such as gold to financial assets such as stocks and bonds. That is, shortly after he became Fed Chief the inflation began to manifest in ways that most people do not associate with an inflation problem. As long as financial asset prices are the ones doing most of the rising hardly anyone will link the rising prices to inflation, let alone consider them to be evidence of an inflation PROBLEM. It is only when gold and commodities are the main beneficiaries of inflation that people worry about an inflation problem.
Which leads us to the question: why did the focus of inflation begin to shift from physical assets to financial assets during the first year of Volcker's chairmanship?
There were, we think, a number of reasons, including the greater confidence inspired by the combination of a Volcker-led Fed and a Reagan-led government, but in our opinion the key factor was valuation: investments that tend to benefit from the perception of a burgeoning inflation problem had become extremely over-priced relative to investments that tend to benefit from the perception of a benign inflation environment. That is, the inflation trade had become way too popular with the investing public, bringing into play the "principle of ever-changing cycles"*. For example, at one point in 1980 the Dow Industrials Index was lower, relative to gold, than it had been at the bottom of the 1929-1932 bear market. With gold at a 60-year high relative to the Dow, with the average US stock having a dividend yield of more than 6% and a P/E ratio of well below 10, and with 10-year Treasury Notes yielding 13%, the markets were primed for major trend reversals.
Note that governments and central banks sold a lot of gold during the second half of the 1970s in an effort to change the trends in the markets, but to no avail. The trends continued, with the occasional interruption, until extremes of under/over-valuation were reached.
Moving ahead to 2000 we find the markets again primed for major trend reversals, but this time with gold at an all-time low relative to the Dow and with the average US stock being valued at around 25-times earnings. Major trend reversals again occurred, with a secular bull market in gold getting underway at the same time as a secular bull market in equities was ending (see chart below). Once again the trends reversed after extremes of under/over-valuation were reached.

On a related matter there's a theory that central banks have tried to suppress the gold price over the past 15 years by lending gold into the market, but regardless of whether this theory is right or wrong it is irrelevant from an investment perspective. We don't know the motivation for the large-scale lending of gold by central banks, but even if we make the assumption that the lending has been done with the aim of keeping a lid on the gold price it is clear that, as was the case with the large-scale gold selling by the official sector during the 1970s, it hasn't altered the long-term trends in the markets. As illustrated by the above chart, a new long-term bull market in gold began exactly when it SHOULD have begun: shortly after the end of the long-term bull market in US equities. As far as forecasting the gold price was concerned, the biggest challenge during the late-1990s was figuring out when the stock market bubble was going to burst. Bubbles, by their nature, tend to go on for much longer than a rational observer expects, and this was certainly the case for the US stock market bubble.
The thing about central bank gold lending is that it will only ever be possible for central banks to lend gold into the market when there are willing borrowers of the gold; and the quantity of willing gold-borrowers in the marketplace will move inversely to the quantity of market participants who think gold is in a bull market (the more people who think gold is in a bull market the smaller will be the pool of potential gold borrowers). This is because a potential gold borrower may well be interested in borrowing gold if he/she expects to be able to repay the loan with cheaper gold in the future, but if he/she believes that gold has a good chance of being more expensive in the future then the idea of borrowing gold will be a lot less appealing.
In other words, the large-scale lending of gold by central banks was a function of the long-term bear market in gold; it was not a cause of it. It undoubtedly exacerbated the downward trend, but the downward trend had to have already been in force in order for the lending/borrowing of gold to become popular.
A good example of how the behaviour of gold borrowers changes in response to changes in price trends is provided by Barrick Gold. Barrick, via its huge forward-sales book, was an important facilitator of central bank gold lending during the 1990s and the early part of the current decade. However, as soon as Barrick's management began to suspect that gold had embarked on a bull market it began to scale-out of the massive gold short position that had been built-up under the guise of hedging; tentatively at first and then aggressively as the bullish trend became more blatant. From being an 'exacerbator' of gold's downward trend during the 1990s Barrick has, over recent years, been an 'exacerbator' of gold's upward trend.
In summary: long-term trends end after valuations reach extremes and not a moment before, regardless of the attempts of governments to manipulate the trends to their own advantage. Furthermore, the fact that there is so much inflation under the current monetary system has resulted, and will continue to result, in markets reaching even greater valuation extremes prior to major trend reversals taking place.
*After the public becomes totally convinced that the future trend is going to be in one direction and bets accordingly the weight of its betting changes the odds to the point where the probability of these bets paying-off becomes exceedingly low. The public's enthusiasm for a particular type of investment or investing strategy therefore paves the way for the cycle to change and for a very different investment type or investing strategy to come to the fore.
*****