Grana y Montero - Emerging Markets
Seite 1 von 1 Neuester Beitrag: 25.04.21 01:51 | ||||
| Eröffnet am: | 05.02.16 23:42 | von: Balu4u | Anzahl Beiträge: | 13 |
| Neuester Beitrag: | 25.04.21 01:51 | von: Leahfbea | Leser gesamt: | 7.283 |
| Forum: | Hot-Stocks | Leser heute: | 1 | |
| Bewertet mit: | ||||
https://en.wikipedia.org/wiki/Gra%C3%B1a_y_Montero
Ganz schöner Kursverfall! Berechtigt? Wiki sagt dazu:
Graña y Montero (BVL: GRAMONC1[1]) is a company which controls a group of 23 subsidiaries in Latin America. It originated as a real estate and construction company, now the oldest and largest in Peru.[2] It is headquartered in Lima. [3]
Optionen
| Boardmail an "Balu4u" |
Wertpapier: Aenza ADR |
Optionen
| Boardmail an "Balu4u" |
Wertpapier: Aenza ADR |
Optionen
| Boardmail an "Balu4u" |
Wertpapier: Aenza ADR |
Optionen
| Boardmail an "wilhelmo1" |
Wertpapier: Aenza ADR |
Optionen
| Boardmail an "wilhelmo1" |
Wertpapier: Aenza ADR |
Gestern: The stock has surged 42.86% in the last one month. The Company's shares are trading above their 50-day moving average by 1.20%. Furthermore, shares of Grana y Montero, which together with its subsidiaries, provides engineering and construction, infrastructure, real estate, and technical services in Latin America, have an RSI of 67.28.
warum rennt die aktie wieder nach oben?
antwort: http://de.reuters.com/article/...ntero-idUKKBN16Z2TX?type=companyNews
antwort: http://de.reuters.com/article/...ntero-idUKKBN16Z2TX?type=companyNews
investor relations (englisch): http://investorrelations.granaymontero.com.pe/
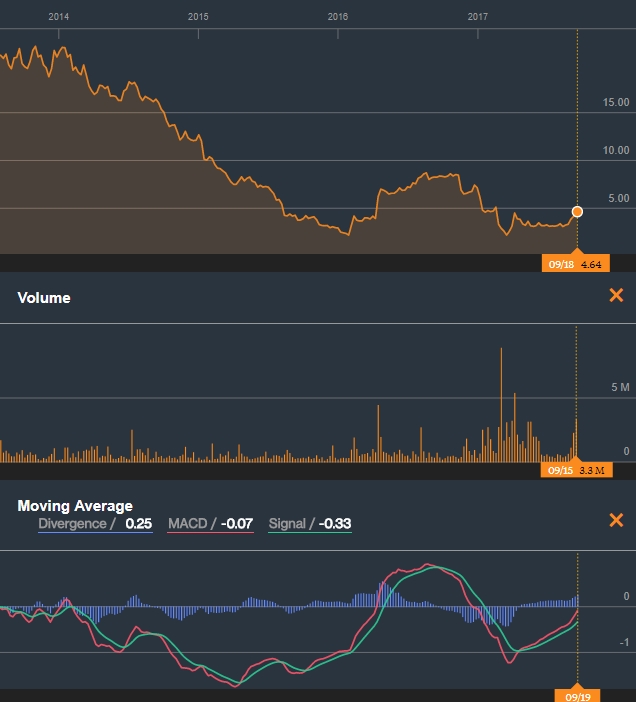
aktie kann charttechnisch bis 8 US$ steigen (aktuell 4,60 US$, https://www.bloomberg.com/quote/GRAM:US , kurs in Lima: 3.01 PEN, http://de.reuters.com/finance/stocks/overview?symbol=GRA.LM )
Number of Analysts 3 (1 Buy, 2 Hold), http://www.4-traders.com/GRANA-Y-MONTERO-SAA-6493441/consensus/
Optionen
| Boardmail an "Raymond_James" |
Wertpapier: Aenza ADR |
Grana y Montero SAA
Market Cap
$3,34 Share Price
x 132,011mio Shares Outstanding
=$442,1mio
$3,34 Share Price
x 132,011mio Shares Outstanding
=$442,1mio
Book Value Per Share
31.12.2016
$803mio Total Equity
/132,011mio Shares Outstanding
=$6,1
31.12.2016
$803mio Total Equity
/132,011mio Shares Outstanding
=$6,1
Diluted EPS (ttm)
2016
in US$
0,165 Mar.
0,080 Jun.
0,079 Sep.
-0,304 Dec.
=0,020 FY 2016
2017
0,185 Mar. ($24,4mio /132,011mio Aktien, http://www.reuters.com/article/peru-grana-y-montero-idUSL1N1I01KW )
2016
in US$
0,165 Mar.
0,080 Jun.
0,079 Sep.
-0,304 Dec.
=0,020 FY 2016
2017
0,185 Mar. ($24,4mio /132,011mio Aktien, http://www.reuters.com/article/peru-grana-y-montero-idUSL1N1I01KW )
Enterprise Value (EV)
mio $
442,1 Market Cap aktuell (s. oben)
+ 897,2 Finanzverbindlichkeiten 31.12.2016
+ 161,7 Anteile Dritter 31.12.2016
- 191,8 Zahlungsmittel und -äquivalente 31.12.2016
=1.309 EV
mio $
442,1 Market Cap aktuell (s. oben)
+ 897,2 Finanzverbindlichkeiten 31.12.2016
+ 161,7 Anteile Dritter 31.12.2016
- 191,8 Zahlungsmittel und -äquivalente 31.12.2016
=1.309 EV
EV / EBITDA 2016
= $1.309mio /$149mio
= 8,8
= $1.309mio /$149mio
= 8,8
Optionen
| Boardmail an "Raymond_James" |
Wertpapier: Aenza ADR |
... by BidaskClub 5 hrs ago, http://www.thelion.com/bin/aio_msg.cgi?cmd=search&symbol=gram
Market Cap
$4,34 Share Price
x 132,011mio Shares Outstanding, https://www.bloomberg.com/quote/GRAM:US
=$573mio
$4,34 Share Price
x 132,011mio Shares Outstanding, https://www.bloomberg.com/quote/GRAM:US
=$573mio
Enterprise Value (EV)
mio $
573 Market Cap aktuell (s. oben)
+857 Finanzverbindlichkeiten 30.06.2017
+156 Eigenkapital-Anteile Dritter 30.06.2017
-177 Zahlungsmittel und -äquivalente 30.06.2017
=1.409 EV
mio $
573 Market Cap aktuell (s. oben)
+857 Finanzverbindlichkeiten 30.06.2017
+156 Eigenkapital-Anteile Dritter 30.06.2017
-177 Zahlungsmittel und -äquivalente 30.06.2017
=1.409 EV
EV-to-EBITDA
= Enterprise Value /EBITDA (TTM)
= $1.409mio /$183mio
= 7,7
= Enterprise Value /EBITDA (TTM)
= $1.409mio /$183mio
= 7,7
Net Income, Quarterly Data
mio $
Q1_2017: 24,42 = $0,185 je Aktie
Q2_2017: 21,47 = $0,162 je Aktie
H1_2017: 45,89 = $0,35 je Aktie
(132,471mio Shares Outstanding (Diluted Average))
mio $
Q1_2017: 24,42 = $0,185 je Aktie
Q2_2017: 21,47 = $0,162 je Aktie
H1_2017: 45,89 = $0,35 je Aktie
(132,471mio Shares Outstanding (Diluted Average))
Optionen
| Boardmail an "Raymond_James" |
Wertpapier: Aenza ADR |
nach dem CONDENSED INTERIM CONSOLIDATED FINANCIAL STATEMENTS AT JUNE 30, 2017, seite 3 (http://investorrelations.granaymontero.com.pe/...o_2Q_2017_Ingles.pdf ) beträgt der halbjahresgewinn 2017:
S/. 148,693mio Profit attributable to Owners of the Company
/660,055mio Shares Outstanding
= S/. 0,225 Earnings per share in H1_2017
x 5 ein ADR der GRAÑA Y MONTERO repräsentiert 5 Original-Aktien (660,055mio Aktien = 132,011mio ADRs)
= S/. 1,126 Earnings je ADR in Sol in H1_2017
= 0,35 US$ Earnings je ADR in US-Dollar in H1_2017
Optionen
| Boardmail an "Raymond_James" |
Wertpapier: Aenza ADR |
Optionen
| Boardmail an "Raymond_James" |
Wertpapier: Aenza ADR |
Angehängte Grafik:
gra_a_y_montero_s.jpg (verkleinert auf 80%)
gra_a_y_montero_s.jpg (verkleinert auf 80%)
in Mio S/. (Peruanischer Sol (PEN))
79,1 Q1_2017, https://stocknews.com/news/...net-income-of-s-79-1-mln-revs-declined/
148,7 H1_2017, https://stocknews.com/news/...-net-income-of-s-148-7m-and-revenue-of/
238,8 9M_2017, https://stocknews.com/news/...ncome-of-s238-8m-and-revenue-of-s4-46b/
/660,055 Mio ausstehende Aktien
=0,36 9M EpS in peruanischem Sol (PEN)
x5 Aktien je ADR
=1,81 9M Earnings per ADR in peruanischem Sol (PEN)
x0,31 Währungsumrechnung: 1 PEN = 0,31 US$, Interbankenkurs am 30.10.2017, https://bankenverband.de/service/waehrungsrechner/
=US$0,56 9M Earnings per ADR
=US$0,75 Earnings per ADR 2017e (annualisiert)
KGV 2017e = 6 (US$4,49/US$0,75)
GRAM News Stream: https://stocknews.com/stock/GRAM/
Optionen
| Boardmail an "Raymond_James" |
Wertpapier: Aenza ADR |