NFX Gold Inc.
Optionen
| Boardmail an "Koch27" |
Wertpapier: Bear Lake Gold |
Angehängte Grafik:
bigchart.png (verkleinert auf 93%)

bigchart.png (verkleinert auf 93%)
Optionen
| Boardmail an "Koch27" |
Wertpapier: Bear Lake Gold |
Angehängte Grafik:
bigchart.png (verkleinert auf 93%)
bigchart.png (verkleinert auf 93%)
Des Bäckers blöde Anleger, und hinterher jammern wieder alle!!!!!!!!
Optionen
| Boardmail an "Koch27" |
Wertpapier: Bear Lake Gold |
Optionen
| Boardmail an "Koch27" |
Wertpapier: Bear Lake Gold |
Optionen
| Boardmail an "Koch27" |
Wertpapier: Bear Lake Gold |
Angehängte Grafik:
Unbenannt.PNG (verkleinert auf 60%)
Unbenannt.PNG (verkleinert auf 60%)
NFX§
NFX GOLD INC
Daily Commentary
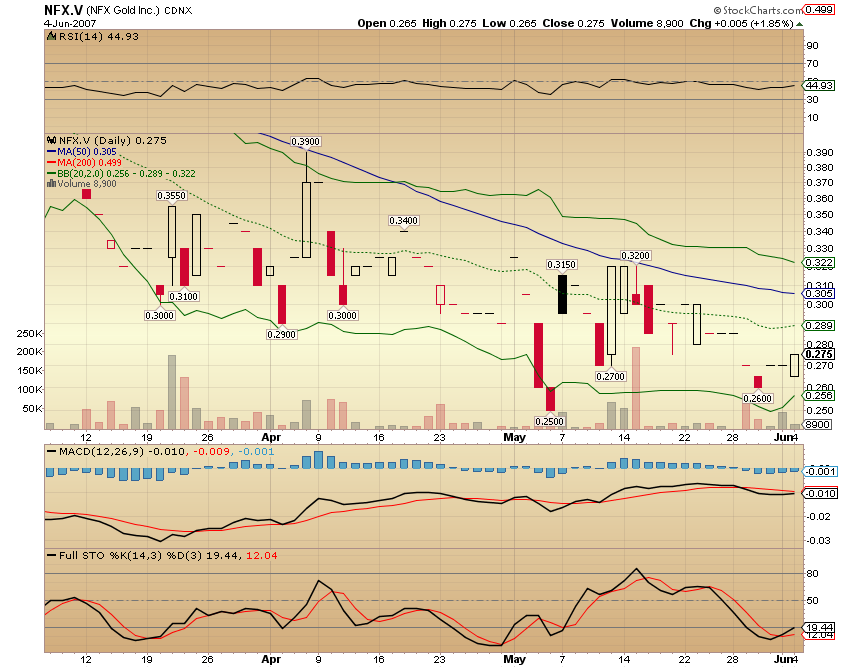
Our system posted a BUY CONFIRMED today. The previous SELL recommendation was issued on 02.26.2007 (98) days ago, when the stock price was 0.4200. Since then NFX has fallen -33.33% .
BUY-IF is confirmed by a white candlestick which has an open equal to the previous close but closing higher. The buying price is the previous close ( 0.2700 ) according to the Rules of Confirmation.
Patience pays off. The market wavered a bit but finally confirmed the recent bullish formation. The dose of the previous day was not enough for a BUY-IF confirmation but today it is. Though the market opened lower today, the day’s activity created a white candlestick that closed above the previous close. This is a valid confirmation criterion. The market is now ready for a bullish move.
We hope that you acted quickly and already bought this stock . Your important benchmark was the previous close. You were supposed to watch the session carefully, feel its bullish tendency despite the lower opening, and go long after making sure that the prices stay over the previous close.
If you bought, continue to hold this stock until the confirmation of the next SELL-IF signal. You are on safe grounds as long as the future prices continue to trade above the benchmark price. What to do if you did not buy? Maybe, you did not have time to follow the session or you simply delegated the delicate job of confirmation to us. Well, it is a bit late, but not too late. You may still find suitable prices for buying in the following sessions.
The market is currently cold for short-sellers. Avoid any short sales and cover the short positions immediately if there are any.
Data provided by: End of Day Data
§
BUY
CONFIRMED
0.2800§
+0.0100 +3.70%
Candlestick Analysis
Today’s Candlestick Patterns:
Short White Candlestick
§
Candlestick Pattern
Today a Short White Candlestick was formed. This represents relatively weak buying pressure with little price movement.
For more about this candlestick click here.
§
Stock Quote
Day's Close 0.2800
Previous Close 0.2700
Previous Open 0.2700
Change +0.0100
% Change +3.70%
Volume 8,900
§
Stock Activity
Day's Open 0.2700
Day's High 0.2800
Day's Low 0.2700
20-Day Close M.A. 0.2910
50-Day Close M.A. 0.3072
65-Day Volume M.A. 30,034
§
Optionen
| Boardmail an "Koch27" |
Wertpapier: Bear Lake Gold |
Daily Commentary
Our system posted a SELL-IF today. The previous BUY recommendation was issued on 06.04.2007 (1) day ago, when the stock price was 0.2700. Since then NFX has gained 0.00% .
A bearish pattern has developed and a SELL-IF alert is issued today. The task is now to confirm the validity of this bearish pattern. We ask your effort and time. A good starting point is to keep an eye on after-hours trading and futures trading to get preliminary hints about market direction. Related news, events, economic data, and the outlook of the world markets must be closely followed prior to confirmation session.
There are three possible cases of bearish confirmation. You have to follow the session closely to see if these cases will hold or not.
The market opens with a downward gap, signaling a bearish sentiment in the first case. Your benchmark will be the opening price. If the prices stay below the benchmark, sell your shares. Any black candlestick with a downward gap is a valid bearish confirmation criterion.
In the second case, the market opens at a level, equal to or above the previous day’s close. The benchmark is that closing price. If prices during the session stay below the benchmark, sell your shares. Any black candlestick closing below the previous day’s close is the second confirmation criterion.
If, however, in both cases, the prices during the session start going over the benchmark avoid selling.
The third case of confirmation is rarely observed. The market opens with a big upward gap suggesting a very bullish day, and the day ends with a black candlestick, but still closing above the previous day’s close. Such a day satisfies the third confirmation criterion and the closing price of the black candlestick is the benchmark.
If one of the three confirmation criteria is not fulfilled, or in case of a white candlestick or a doji on the confirmation day, the SELL-IF alert remains valid, however, without confirmation and the three confirmation criteria are then sought in the following day. The only exception is the long white candlestick. Any white candlestick following a SELL-IF alert makes the signal void and invalid.
The market looks strong on the short side. So you may continue to carry the existing short positions. If the SELL-IF is confirmed, new short sale positions may be considered.
Data provided by: End of Day Data
§
SELL-IF
0.2700§
-0.0100 -3.57%
Candlestick Analysis
Today’s Candlestick Patterns:
Doji
Bearish Harami Cross
§
Candlestick Pattern
Today a Doji was formed. This shows indecision about the direction of the market and it represents a tug-of-war between buyers and sellers.
For more about this candlestick click here.
The last two candlesticks formed a Bearish Harami Cross Pattern . This is a bearish reversal pattern that marks a potential change in trend. However, its reliability is not very high and it requires confirmation.
For more about this pattern click here.
§
Stock Quote
Day's Close 0.2700
Previous Close 0.2800
Previous Open 0.2700
Change -0.0100
% Change -3.57%
Volume 20,500
§
Optionen
| Boardmail an "Koch27" |
Wertpapier: Bear Lake Gold |
Optionen
| Boardmail an "Koch27" |
Wertpapier: Bear Lake Gold |
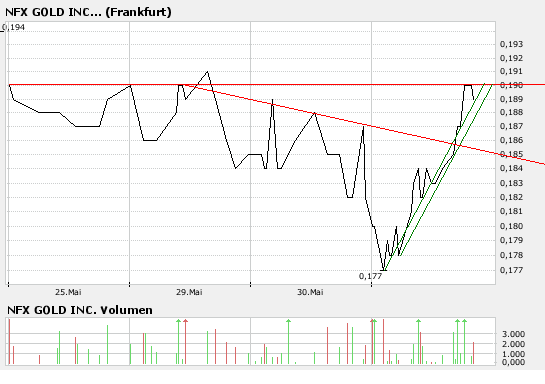
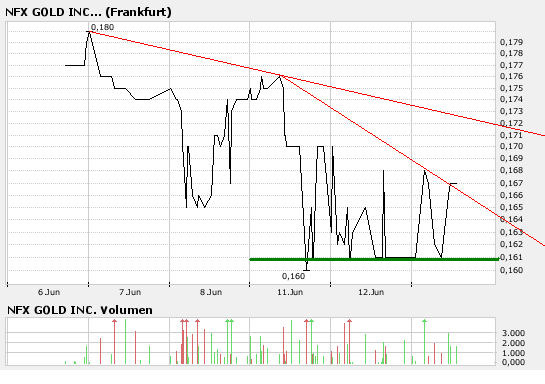
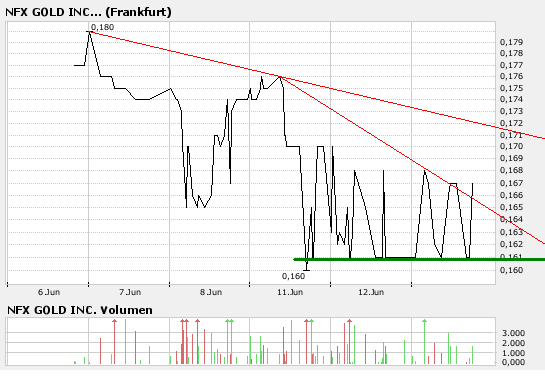
werden wir abprallen oder durchgehen?????
Optionen
| Boardmail an "Koch27" |
Wertpapier: Bear Lake Gold |
Optionen
| Boardmail an "Koch27" |
Wertpapier: Bear Lake Gold |
Optionen
| Boardmail an "Koch27" |
Wertpapier: Bear Lake Gold |
Angehängte Grafik:
bigchart.png (verkleinert auf 93%)
bigchart.png (verkleinert auf 93%)
Optionen
| Boardmail an "Koch27" |
Wertpapier: Bear Lake Gold |
Optionen
| Boardmail an "Koch27" |
Wertpapier: Bear Lake Gold |
Angehängte Grafik:
bigchart.png (verkleinert auf 93%)
bigchart.png (verkleinert auf 93%)
Optionen
| Boardmail an "Koch27" |
Wertpapier: Bear Lake Gold |
Optionen
| Boardmail an "Hightoy" |
Wertpapier: Bear Lake Gold |
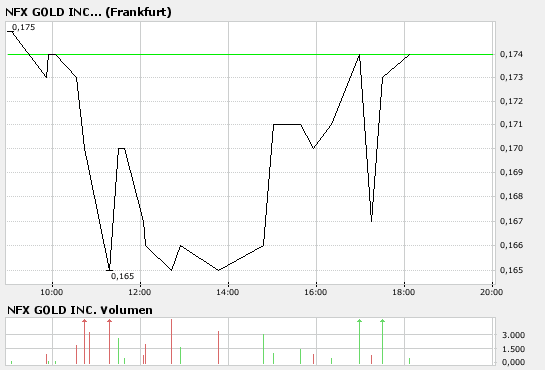
Bid in Can umgerechnet bei ca. 18 cent!!!
Optionen
| Boardmail an "Koch27" |
Wertpapier: Bear Lake Gold |
Optionen
| Boardmail an "Koch27" |
Wertpapier: Bear Lake Gold |
Angehängte Grafik:
bigchart.png (verkleinert auf 93%)
bigchart.png (verkleinert auf 93%)
Optionen
| Boardmail an "Koch27" |
Wertpapier: Bear Lake Gold |
Angehängte Grafik:
bigchart.png (verkleinert auf 93%)
bigchart.png (verkleinert auf 93%)
Denn: Es mag vielleicht nicht viel sein, aber etwas Substans ist vorhanden!!!
Hirngspinntst:
Wenn nur jeder der mit den schrecklichen3 Geld verloren hat,
hier und in MXV wieder einsteigt und dann die richtige Nachricht kommt, sind alle wieder glücklich!!!
Keine Aufforderung zum Kauf!
Nicht das dann alle den Koch hassen, reicht schon wenns ein Bäcker ist auf den alle rumhauen!
Optionen
| Boardmail an "Koch27" |
Wertpapier: Bear Lake Gold |
zusätzlich stützen. Davon hätten wir alle viel mehr!! :-)
Warren B.
Optionen
| Boardmail an "Koch27" |
Wertpapier: Bear Lake Gold |