Jegliche Solarwerte nicht attraktiv !!
Meldungen Deutschland & Europa
Neue Energiepolitik
Union plant Angriff auf Solarbranche
[08:54, 29.11.10]
... (automatisch gekürzt) ...
http://www.immobilien-kompass.de/nachrichten/energie-sanieren
Moderation
Zeitpunkt: 08.12.10 16:04
Aktion: Kürzung des Beitrages
Kommentar: Urheberrechtsverletzung, bitte nur zitieren
Original-Link: http://www.immobilien-kompass.de/...ichten/energie-sanieren
Zeitpunkt: 08.12.10 16:04
Aktion: Kürzung des Beitrages
Kommentar: Urheberrechtsverletzung, bitte nur zitieren
Original-Link: http://www.immobilien-kompass.de/...ichten/energie-sanieren
Optionen
| Boardmail an "andyy" |
Wertpapier: TecDAX (Performance) |
Optionen
| Boardmail an "andyy" |
Wertpapier: TecDAX (Performance) |
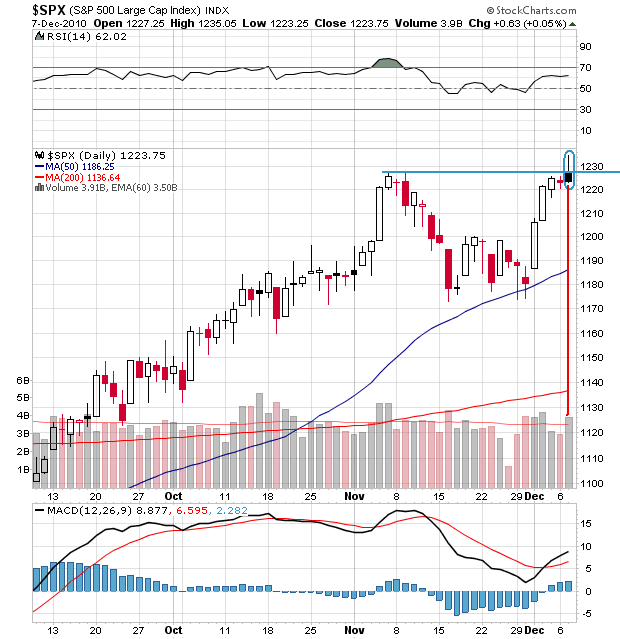
Angehängte Grafik:
_spx3m.png (verkleinert auf 82%)
_spx3m.png (verkleinert auf 82%)
oder auch tiefer
dann sagt nicht - ich hätte nicht gewarnt
dann sagt nicht - ich hätte nicht gewarnt
Optionen
| Boardmail an "andyy" |
Wertpapier: TecDAX (Performance) |
gleich ist alles rot
aber der tecdax 1% im plus
es ist keinem zu helfen
aber der tecdax 1% im plus
es ist keinem zu helfen
Optionen
| Boardmail an "andyy" |
Wertpapier: TecDAX (Performance) |
Hindenburg Omen Hindenburg Omen
From Wikipedia, the free encyclopedia Aus Wikipedia, der freien Enzyklopädie
Jump to: navigation , search Wechseln zu: Navigation , Suche
The Hindenburg Omen is a technical analysis pattern that is said to portend a stock market crash . Die Hindenburg Omen ist eine technische Analyse , dass ein Muster soll bedeuten, um Börsencrash . It is named after the Hindenburg disaster of May 6, 1937, during which the German Zeppelin Hindenburg was destroyed. Es ist benannt nach der Hindenburg Katastrophe von 6. Mai 1937, bei dem der deutsche Zeppelin Hindenburg wurde zerstört.
Contents Inhalt [hide]
1 History 1 Geschichte
2 Mechanics 2. Mechanik
3 Criteria 3 Kriterien
4 Possible weaknesses 4 Mögliche Schwächen
5 Conclusions 5 Schlussfolgerungen
6 Recent occurrences 6 Neueste Ereignisse
7 References 7 Referenzen
8 External links 8 Externe Links
[ edit ] History [ Bearbeiten ] Geschichte
The Omen is largely based on Norman G. Fosback's High Low Logic Index (HLLI). [ 1 ] The value of the HLLI is the lesser of the NYSE new highs or new lows divided by the number of NYSE issues traded, smoothed by an appropriate exponential moving average . Das Omen ist groß. Basierend auf Norman G. Fosback 's High Low Logic Index (HLLI) [1] Der Wert der HLLI ist der kleinere der NYSE neue Hochs oder neue Tiefs gehandelt, geteilt durch die Anzahl der NYSE Probleme, geeignete geglättet durch eine exponential moving average . The Omen itself is said to have originated with Jim Miekka [ 2 ] , and the name was suggested by the late Kennedy Gammage. Das Omen selbst soll Miekka Jim entstanden mit [2] , und der Name war Gammage vorgeschlagen von dem verstorbenen Kennedy.
[ edit ] Mechanics [ Bearbeiten ] Mechanik
The Hindenburg Omen is a combination of technical factors that attempt to measure the health of the NYSE , and by extension, the stock market as a whole. Die Hindenburg Omen ist eine Kombination von technischen Faktoren, die den Versuch zur Messung der Gesundheit NYSE und durch die Erweiterung, den Aktienmarkt als Ganzes. The goal of the indicator is to signal increased probability of a stock market crash . Das Ziel des Indikators ist es, ein Signal erhöhte Wahrscheinlichkeit Börsencrash .
The rationale is that under "normal conditions" either a substantial number of stocks may set new annual highs or annual lows, but not both at the same time. Der Grund ist, dass unter "normalen Bedingungen" mit einer erheblichen Anzahl von Aktien können Tiefs setzen neue Jahreshöchststände oder jährlich, aber nicht beides gleichzeitig. As a healthy market possesses a degree of uniformity, whether up or down, the simultaneous presence of many new highs and lows may signal trouble. Als gesundes Markt besitzt ein gewisses Maß an Einheitlichkeit, ob oben oder unten, die gleichzeitige Anwesenheit vieler neuer Hochs und Tiefs möglicherweise Schwierigkeiten Signal.
[ edit ] Criteria [ Bearbeiten ] Kriterien
These criteria are calculated daily using Wall Street Journal figures for consistency. Diese Kriterien sind Konsistenz berechnet täglich mit Wall Street Journal Zahlen. (Other exchanges may be used as well.) Some have been recalibrated by Miekka to reduce statistical noise and make the indicator a more reliable predictor of a future decline. (Andere Börsen können ebenso verwendet werden.) Einige haben von Miekka wurde angepasst, um statistische Rauschen zu verringern und die Anzeige einer zuverlässigeren Indikator für eine zukünftige Rückgang.
The daily number of NYSE new 52 week highs and the daily number of new 52 week lows are both greater than or equal to 2.8 percent (typically, 84) of the sum of NYSE issues that advance or decline that day (typically, around 3000) [ 3 ] . Die tägliche Zahl der NYSE neuen 52 Wochen-Hochs und der Zahl der täglich neuen 52 Wochen-Tiefs sind beide größer als oder gleich 2,8 Prozent (in der Regel 84) der Summe der NYSE Fragen, Vorauskasse oder Rückgang an diesem Tag (in der Regel um 3000) [3] . An older version of the indicator used a threshold of 2.5 percent of total issues traded (approximately 80 of 3200 in today's market). Eine ältere Version des verwendeten Indikators einen Schwellenwert von 2,5 Prozent der gesamten Ausgaben gehandelt werden (etwa 80 von 3200 auf dem heutigen Markt).
The NYSE index is greater in value than it was 50 trading days ago. Die NYSE-Index ist größer als der Wert vor 50 Börsentage vor war. Originally, this was expressed as a rising 10 week moving average , but the new rule is more relevant to the daily data used to look at new highs and lows. Ursprünglich war diese Woche ausgedrückt als erreichte mit 10 gleitenden Durchschnitt , aber die neue Regel wird stärker auf die Tageswerte benutzt, um Tiefs Blick auf neue Hochs und.
The McClellan Oscillator is negative on the same day. Der McClellan Oszillator negativ ist am selben Tag.
New 52 week highs cannot be more than twice the new 52 week lows (though new 52 week lows may be more than double new highs). Neue 52 Wochen Hochs kann nicht mehr als das Doppelte des neuen 52 Wochen-Tief (obwohl neuen 52 Wochen-Tiefs können mehr als doppelt so neue Höchststände werden).
The traditional definition requires each condition to occur on the same day. Die traditionelle Definition erfordert jede Bedingung auf den selben Tag erfolgen. Once the signal has occurred, it is valid for 30 days, and any additional signals given during the 30-day period should be ignored. Sobald das Signal aufgetreten ist, wird es für 30 Tage gültig und zusätzliche Signale während der 30-Tage-Frist gegeben sollten ignoriert werden. During the 30 days, the signal is activated whenever the McClellan Oscillator is negative, but deactivated whenever it is positive. [ 4 ] Während der 30 Tage, ist das Signal aktiviert, wenn der Oszillator McClellan negativ ist, aber deaktiviert, wenn sie positiv ist. [4]
[ edit ] Possible weaknesses [ Bearbeiten ] Mögliche Schwächen
To eliminate false positives some technical analysts have imposed the condition that the Hindenburg Omen Um Fehlalarme zu eliminieren einige technische Analysten haben die Bedingung auferlegt, dass die Hindenburg Omen
must be triggered three times in a row within a month from the first triggering event for said initial trigger signal to be considered to be valid (ie requires double confirmation) muss ausgelöst dreimal in Folge innerhalb eines Monats ab dem ersten auslösende Ereignis für anfängliche sagte Triggersignal als gültig zu sein (dh doppelte Bestätigung erforderlich)
is only valid when "all tightly coupled triggerings are within a fortnight" ist nur gültig, wenn "alle eng gekoppelten Auslösungen innerhalb von vierzehn Tagen sind"
will indicate a possible future downturn or correction, depending on the magnitude of any "one off" triggering wird eine mögliche Zukunft Abschwung oder Korrektur geben, abhängig von der Größe eines "one off" Triggerung
[ edit ] Conclusions [ Bearbeiten ] Schlussfolgerungen
From historical data, the probability of a move greater than 5% to the downside after a confirmed Hindenburg Omen was 77% [The Wall Street Journal 8/23/2010 article cited below states that accuracy is 25%, looking at period from 1985], and usually takes place within the next forty days. Aus historischen Angaben, die Wahrscheinlichkeit einer Bewegung von mehr als 5% auf die Kehrseite nach einer bestätigten Hindenburg Omen betrug 77% [The Wall Street Journal 2010.08.23 Artikel unten Staaten angeführt, dass die Genauigkeit von 25% ist, schauen Zeitraum von 1985] und erfolgt in der Regel innerhalb der nächsten 40 Tage. The probability of a panic sellout was 41% and the probability of a major stock market crash was 24%. Die Wahrscheinlichkeit einer Panik Ausverkauf betrug 41% und die Wahrscheinlichkeit eines großen Börsenkrach war 24%. Though the Omen does not have a 100% success rate, every NYSE crash since 1985 has been preceded by a Hindenburg Omen. Obwohl das Omen haben nicht eine 100% ige Erfolgsquote, jedes NYSE Crash 1985 hat seit Hindenburg Omen voraus von einem. Of the previous 25 confirmed signals only two (8%) have failed to predict at least mild (2.0% to 4.9%) declines. Von den bisherigen 25 bestätigt Signale nur zwei (8%) haben es versäumt, prognostizieren zumindest mild (2,0% bis 4,9%) Rückgänge.
Because of the specific and seemingly random nature of the Hindenburg Omen criteria, the phenomenon may be simply a case of overfitting . Aufgrund der spezifischen und scheinbar zufällige Natur der Hindenburg Omen Kriterien Phänomen kann das einfach ein Fall von Überanpassung . That is, by backtesting through a large data set with many different variables, correlations can be found that do not really have predictive significance. Das heißt, durch Backtesting durch eine große Daten Variablen mit vielen verschiedenen, Korrelationen Bedeutung sein, dass nicht wirklich prädiktive. The Omen is at best an imperfect technical indicator that is a work in progress. Das Omen ist bestenfalls eine unvollkommene technische Indikator dafür, dass ein work in progress ist.
[ edit ] Recent occurrences [ Bearbeiten ] Aktuelle Ereignisse
August 12, 2010: The Omen's creator, Jim Miekka, considered the Omen officially triggered on this date with 92 and 81 new 52-week highs and lows, respectively. 12. August 2010: Das Omen Schöpfer Jim Miekka, als das Omen offiziell ausgelöst zu diesem Zeitpunkt mit 92 und 81 neue 52-Wochen-Hochs und Tiefs, beziehungsweise. The McClellan Oscillator was a negative -120.03 and the 10-week NYSE moving average was rising; the market closed above its open of 50 days prior (May 27). [ 5 ] . Der McClellan Oszillator eine negative -120,03 und der 10-wöchigen NYSE gleitenden Durchschnitt stieg, der Markt geschlossen über die offene von 50 Tagen vor (27. Mai). [5] . In the ensuing week, the Omen narrowly missed confirmation twice (August 13 and 19). In der anschließenden Woche, das Omen knapp verfehlt Bestätigung zweimal (13. August und 19).
August 20, 2010: According to the Wall Street Journal , the omen was confirmed on Friday, with 83 new 52-week highs and 95 new 52-week lows on the NYSE. 20. August 2010: Nach dem Wall Street Journal , Omen war am Freitag bestätigte auf, mit 83 neuen 52-Wochen-Hochs und 95 neue 52-Wochen-Tiefs an der NYSE. The McClellan Oscillator was a negative -106.46 and the 10-week NYSE moving average was rising; the market closed above its open of 50 days prior (June 11). [ 6 ] Der McClellan Oszillator eine negative -106,46 und der 10-wöchigen NYSE gleitenden Durchschnitt stieg; Markt geschlossen über die offene von 50 Tagen vor (11. Juni). Das [6]
August 24, 2010: 166 New Lows, 87 new Highs, McClellan Oscillator was negative, but the 10 week average began to fall. 24. August 2010: 166 neue Tiefstände, 87 neue Höchststände, McClellan Oszillator war negativ, aber die 10 Wochen-Durchschnitt begann zu fallen. (Non-Confirmation.) (Although the 12 week average is still positive.) (Non-Confirmation.) (Obwohl der 12-Wochen-Durchschnitt immer noch positiv ist.)
August 25, 2010: 150 New Lows, 90 new Highs, McClellan Oscillator was negative, but again the 10 week average was falling (Non-Confirmation.) (Although the 12 week average is still positive.) 25. August 2010: 150 neue Tiefstände, 90 neue Höchststände, McClellan Oszillator negativ war, aber wieder die 10 Wochen-Durchschnitt fiel (Non-Confirmation.) (Obwohl der 12-Wochen-Durchschnitt immer noch positiv ist.)
August 31, 2010: 86 New Lows, 164 new Highs, McClellan Oscillator was negative, and the 10 week moving average was up slightly 8.86 (0.13%) but falling (non-confirmation) 31. August 2010: 86 neue Tiefstände, 164 neue Höchststände, McClellan Oszillator war negativ, und die 10 Wochen-Durchschnitt stieg leicht 8,86 (0,13%), sondern fallen (Nicht-Bestätigung)
December 14, 2010: 113 New Lows, 179 New Highs, 3063 Advancers+Decliners, McClellan Oscillator was negative (-5.36), NYSE Composite Index closed at 7855.22 vs 7272.53 50 trading days prior (October 4, 2010), and the 10 week moving average was rising. 14. Dezember 2010: 113 neue Tiefstände, 179 New Highs, 3063 Six Sigma + Decliners, McClellan Oszillator negativ (-5,36), NYSE Composite Index schloss bei 7.855,22 7.272,53 vs 50 Börsetage vor (4. Oktober 2010) und die 10 Wochen Moving Average stieg.
[ edit ] References [ Bearbeiten ] Referenzen
^ Fosback, Norman (1979). ^ Fosback, Norman (1979). "20". Stock Market Logic . ISBN 0-917604-48-2 . "20". Stock Market Logic. ISBN 0-917604-48-2 .
^ Morris, Gregory (2005). The Complete Guide to Market Breadth Indicators: How to Analyze and Evaluate Market Direction and Strength , p. ^ Morris, Gregory (2005):. The Complete Guide to Marktbreite Indikatoren Wie zu analysieren und auszuwerten Market Richtung und Stärke, S. 219. 219. McGraw-Hill. McGraw-Hill. ISBN-10: 0071444432. ISBN-10: 0071444432.
^ Morris, Gregory (2005). The Complete Guide to Market Breadth Indicators: How to Analyze and Evaluate Market Direction and Strength , p. ^ Morris, Gregory (2005):. The Complete Guide to Marktbreite Indikatoren Wie zu analysieren und auszuwerten Market Richtung und Stärke, S. 219. 219. McGraw-Hill. McGraw-Hill. ISBN-10: 0071444432. ISBN-10: 0071444432.
^ Morris, Gregory (2005). The Complete Guide to Market Breadth Indicators: How to Analyze and Evaluate Market Direction and Strength , p. ^ Morris, Gregory (2005):. The Complete Guide to Marktbreite Indikatoren Wie zu analysieren und auszuwerten Market Richtung und Stärke, S. 219. 219. McGraw-Hill. McGraw-Hill. ISBN-10: 0071444432. ISBN-10: 0071444432.
^ http://www.tampabay.com/news/business/markets/...tors-can-see/1116060 ^ http://www.tampabay.com/news/business/markets/...tors-can-see/1116060
^ Russolillo, Steven (August 23, 2010). "Yes Folks, Hindenburg Omen Tripped Again" . The Wall Street Journal . http://blogs.wsj.com/marketbeat/2010/08/23/...urg-omen-tripped-again/ . ^ Russolillo, Steven (23. August 2010). "Ja Leute, Hindenburg Omen Ausgelöst Again" . Das Wall Street Journal. http://blogs.wsj.com/marketbeat/2010/08/23/yes-folks-hindenburg- Omen-stolperte-wieder / .
[ edit ] External links [ Bearbeiten ] Externe Links
The Hindenburg Omen Signals between 2005 and 2007 Die Hindenburg Omen Signale zwischen 2005 und 2007
The Past Performance of the Hindenburg Omen Stock Market Crash Signals 1985 - 2005 Die Wertentwicklung der Vergangenheit des Hindenburg-Omen Börsenkrach Signale 1985 - 2005
McHugh's "Guest Available" article explaining the signal and documenting its performance. McHugh's "Guest verfügbar" Artikel, der Signal-und dokumentieren ihre Leistung.
Hindenburg Omen in 2008 July 4, 2008 The Market Oracle . Hindenburg Omen im Jahr 2008 4. Juli 2008 Der Markt Oracle.
Crash Landing? Barron's July 7, 2008 comments on 2008 Hindenburg Omen Crash Landing? Barron's 7. Juli 2008 Kommentare auf 2008 Hindenburg Omen
My Two Cents - Andy Sutton - "Hurricane Hunter" - 09/25/2009 Meine zwei Cent - Andy Sutton - "Hurricane Hunter" - 2009.09.25
Yahoo Finance - 08/25/2010 Yahoo Finance - 2010.08.25
Wall Street Journal - 08/23/2010 Confirmed Hindenburg Omen Wall Street Journal - 2010.08.23 Bestätigt Hindenburg Omen
[hide]v • d • e v • d • e Stock market crashes Kurseinbrüche an den Börsen
1796–1797 panic • 1819 panic • 1837 panic • 1847 panic • 1857 panic • Black Friday • 1873 panic • 1882 Paris Bourse crash • 1884 panic • 1893 panic • 1896 panic • 1901 panic • 1907 panic • Depression of 1920–21 • 1929 Wall Street crash • 1937–1938 recession • 1973–1974 stock market crash • Silver Thursday • Souk Al-Manakh stock market crash • Black Monday • Friday the 13th mini-crash • Japanese asset price bubble • Black Wednesday • 1997 Asian financial crisis • 1997 mini-crash • 1998 Russian financial crisis • dot-com bubble • September 11 • 2002 stock market downturn • Chinese correction • 2007–2009 United States bear market • Dubai debt standstill • European debt crisis • May 6, 2010 flash crash • 1796-1797 Panik • 1819 Panik • 1837 Panik • 1847 Panik • 1857 Panik • Black Friday • 1873 Panik • 1882 Paris Bourse Absturz • 1884 Panik • 1893 Panik • 1896 Panik • 1901 Panik • Panik von 1907 • Depression von 1920-21 • 1929 Wall Street Crash • 1937-1938 Rezession • 1973-1974 Börsencrash • Silver Donnerstag • Souk Al-Manakh Börsencrash • Black Monday • Freitag, der 13. Mini-Crash • japanischen Asset Preisblase • Schwarzer Mittwoch • asiatischen Finanzkrise 1997 • 1997 Mini-Crash • russische Finanzkrise von 1998 • Dotcom-Blase • 11. September • Aktienoptionsprogramm 2002 Abschwung • Chinesische Korrektur • 2007-2009 Vereinigten Staaten Bärenmarkt • Dubai Schulden Stillstand • Europäische Schuldenkrise • 6. Mai 2010 Flash-Crash •
List of stock market crashes Liste der Kurseinbrüche an den Börsen
Retrieved from " http://en.wikipedia.org/wiki/Hindenburg_Omen " Von " http://en.wikipedia.org/wiki/Hindenburg_Omen "
Categories : Stock market | Stock market crashes | Technical analysis Kategorien : Aktienmarkt | Börsencrashs | Technische Analyse
Personal tools Persönliche Werkzeuge
Log in / create account Anmelden / Benutzerkonto anlegen Namespaces Namespaces
Article Artikel Discussion Diskussion Variants Varianten Views Aufrufe
Read Lesen Edit Bearbeiten View history Verlauf anzeigen Actions Aktionen Search Suche
Navigation Navigation
Main page Startseite Contents Inhalt Featured content Featured Content Current events Aktuelle Veranstaltungen Random article Zufälliger Artikel Donate to Wikipedia Spenden Sie für Wikipedia Interaction Interaktion
Help Hilfe About Wikipedia Über Wikipedia Community portal Community Portal Recent changes Letzte Änderungen Contact Wikipedia Kontakt gelistet Toolbox Toolbox
What links here Links auf diese Seite Related changes Verlinkte Seiten Upload file Datei hochladen Special pages Spezielle Seiten Permanent link Permanenter Link Cite this page Zitieren Sie diese Seite Print/export Drucken / Export
Create a book Erstellen Sie ein Buch Download as PDF Download als PDF Printable version Druckversion Languages Sprachen
Français Français 中文 中文 This page was last modified on 15 December 2010 at 00:22. Diese Seite wurde zuletzt am 15. Dezember 2010 um 00:22 Uhr geändert.
Text is available under the Creative Commons Attribution-ShareAlike License Text ist verfügbar unter der Creative Commons Attribution-ShareAlike Lizenz ; additional terms may apply. , Zusätzliche Bedingungen gelten. See Terms of Use for details. Siehe Nutzungsbedingungen für Details.
Wikipedia® is a registered trademark of the Wikimedia Foundation, Inc. , a non-profit organization. Wikipedia ® ist eine eingetragene Marke der Wikimedia Foundation, Inc. , einer Non-Profit-Organisation.
Contact us Kontaktieren Sie uns
Privacy policy Privacy policy About Wikipedia Über Wikipedia Disclaimers Lizenzbestimmungen
Optionen
| Boardmail an "andyy" |
Wertpapier: TecDAX (Performance) |
gestern wurde es bereits erneut bestätigt
also 10 % Rutsche wäre kein Problem
also 10 % Rutsche wäre kein Problem
Optionen
| Boardmail an "andyy" |
Wertpapier: TecDAX (Performance) |
Banken können DAX fallen lassen
es geht abwärts
es geht abwärts
Optionen
| Boardmail an "andyy" |
Wertpapier: TecDAX (Performance) |
14.01. rückt auch näher
Hindenburg lässt grüssen
Hindenburg lässt grüssen
Optionen
| Boardmail an "andyy" |
Wertpapier: TecDAX (Performance) |
wenn wieder alle durch die kleine Türe raus wollen
was da abgeht
was da abgeht
Optionen
| Boardmail an "andyy" |
Wertpapier: TecDAX (Performance) |
Hindenburg stürzt erst heute ab
der Markt hinterher
der Markt hinterher
Optionen
| Boardmail an "andyy" |
Wertpapier: TecDAX (Performance) |
das ende war schon vor über einem jahr ausgerufen
deutschland kürzt
china liefert den rest
das kann nicht gut gehen
deutschland kürzt
china liefert den rest
das kann nicht gut gehen
Optionen
| Boardmail an "andyy" |
Wertpapier: TecDAX (Performance) |