Lügt der Chart ? Jinshan Goldmines ?
Seite 1 von 1 Neuester Beitrag: 28.06.17 10:40 | ||||
| Eröffnet am: | 19.02.07 14:44 | von: sibiano | Anzahl Beiträge: | 3 |
| Neuester Beitrag: | 28.06.17 10:40 | von: Vassago | Leser gesamt: | 6.066 |
| Forum: | Hot-Stocks | Leser heute: | 5 | |
| Bewertet mit: | ||||
www.jinshanmines.com
Schlaft ruhig weiter, diskutiert endlos über Penny Stocks und seht zu wie die Post wo anders weitergeht.
Angehängte Grafik:
jinshan.png
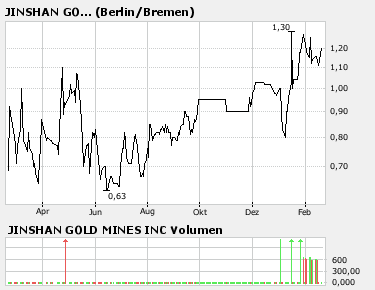
jinshan.png
gehe zum Anfangspunkt und messe 37° ein
mit dem Lineal einen Strich Richtung Nord ziehen
fertig
wenn das immer so sein würde
GrB
Optionen
| Boardmail an "buran" |
Wertpapier: China Gold Internationa |
China Gold International platziert 500 Mio. $ Bond am Markt, mal sehen was sie mit dem Geld machen:
"Bing Liu, chief executive officer of the company, noted, "This is the second time our company has successfully managed a bond offering in the international capital markets thus allowing us to demonstrate that we can take advantage of a diversified, global, financing capability putting us in position to more aggressively pursue our global growth through acquisitions and organic development strategy."
Optionen
| Boardmail an "Vassago" |
Wertpapier: China Gold Internationa |