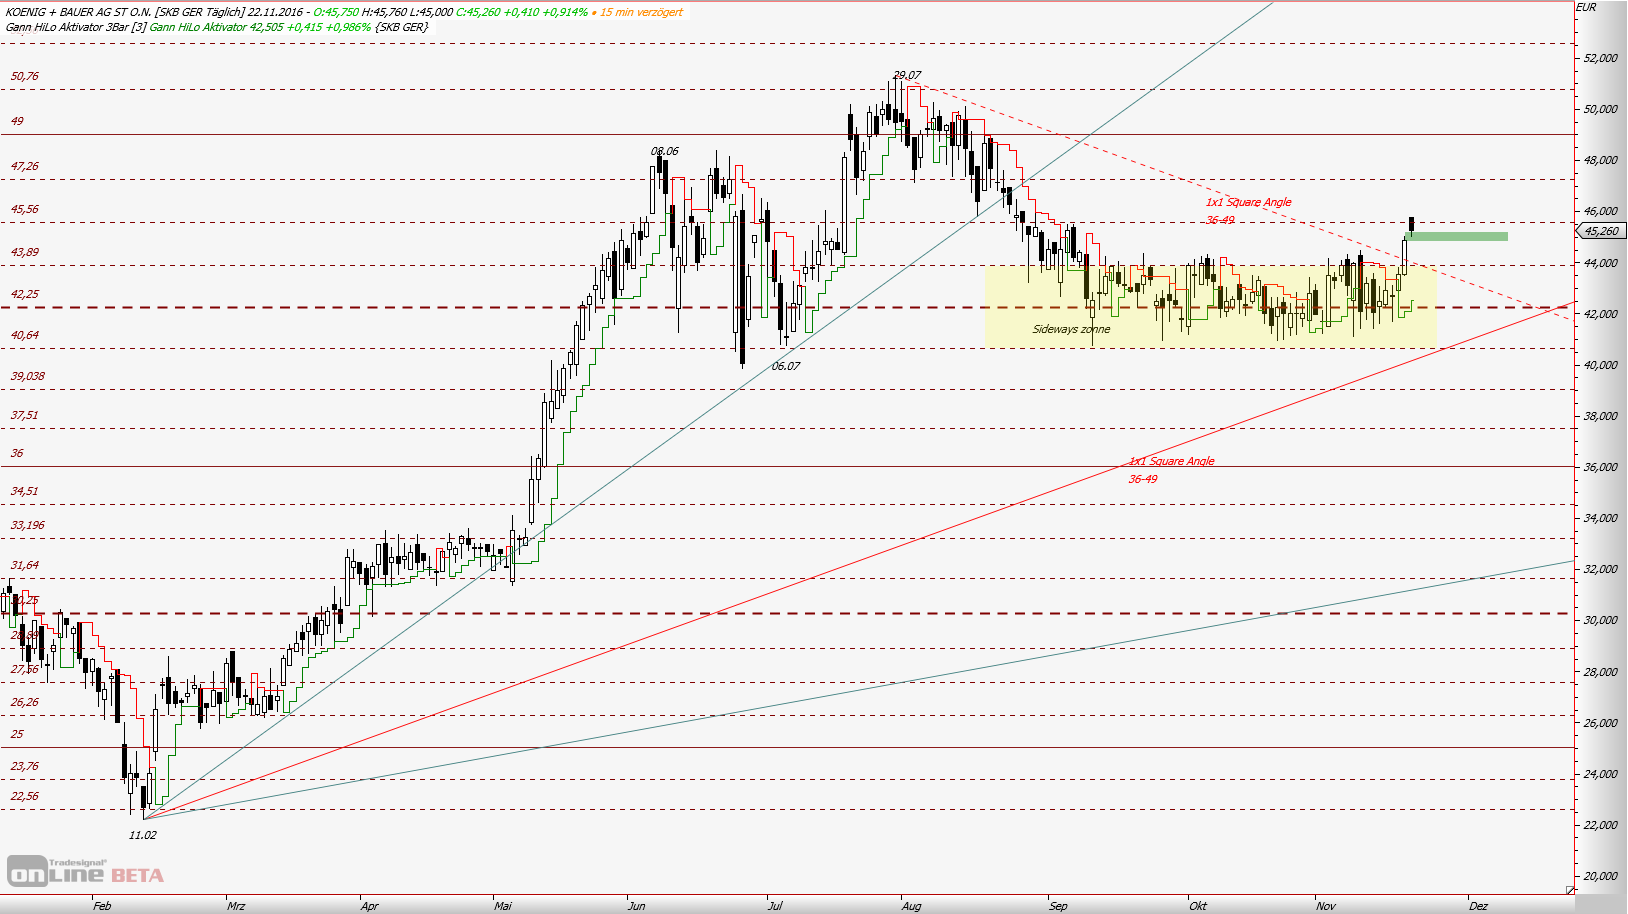
König&Bauer Charttechnik
Wenn der Gesamtmarkt mitspielt könnte bis zumindest November hier was gehen.
Für die externen Mitleser: Technische Signal können falsch sein, Investoren handeln auf eigenes Risiko.
Optionen
| Boardmail an "ulsi" |
Wertpapier: Koenig & Bauer AG |
Ich würde behaupten, dass Kurs wieder den Hoch vom 29.07 ins Visier nimmt.
Optionen
| Boardmail an "ulsi" |
Wertpapier: Koenig & Bauer AG |
Angehängte Grafik:
kba141016.png (verkleinert auf 47%)
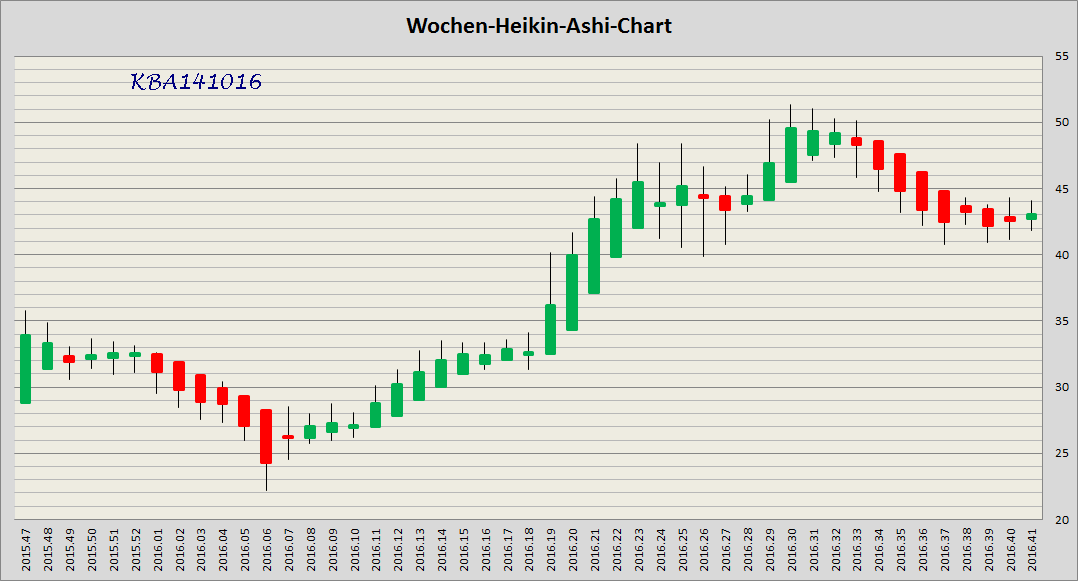
kba141016.png (verkleinert auf 47%)
Optionen
| Boardmail an "ulsi" |
Wertpapier: Koenig & Bauer AG |
Angehängte Grafik:
kba211016.png (verkleinert auf 47%)
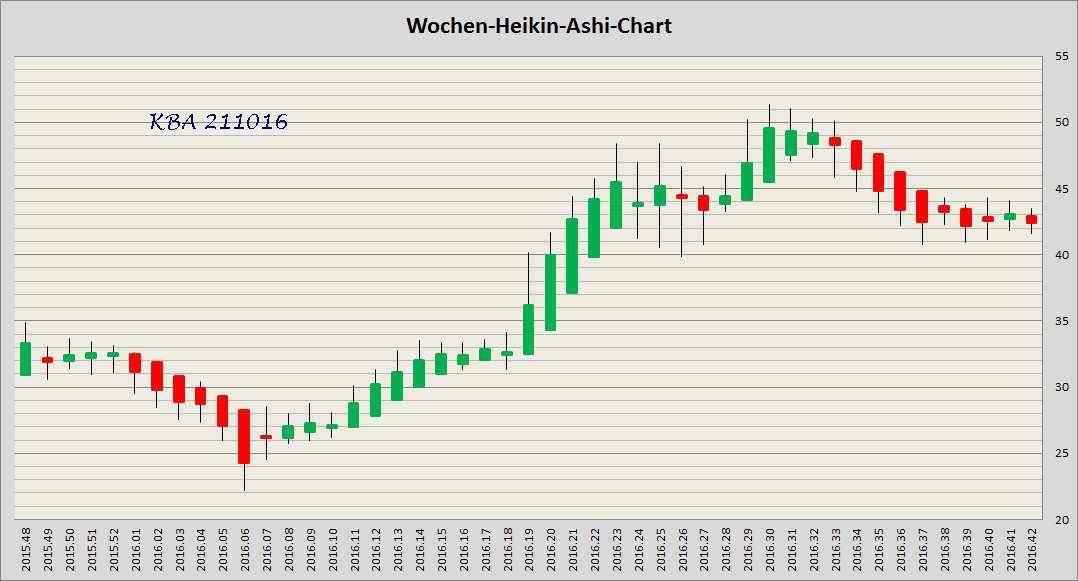
kba211016.png (verkleinert auf 47%)
Presently, the 14-day ADX for Koenig & Bauer AG (SKB.DE) is resting at 17.01. Generally speaking, an ADX value from 0-25 would indicate an absent or weak trend. A value of 25-50 would indicate a strong trend. A value of 50-75 would signal a very strong trend, and a value of 75-100 would indicate an extremely strong trend. The Average Directional Index or ADX may prove to be an important tool for trading or investing. The ADX is a technical indicator developed by J. Welles Wilder used to determine the strength of a trend. The ADX is often used along with the Plus Directional Indicator (+DI) and Minus Directional Indicator (-DI) to identify the direction of the trend.
Moving average indicators are used widely for stock analysis. Many traders will use a combination of moving averages with different time frames to help review stock trend direction. One of the more popular combinations is to use the 50-day and 200-day moving averages. Investors may use the 200-day MA to help smooth out the data a get a clearer long-term picture. They may look to the 50-day or 20-day to get a better grasp of what is going on with the stock in the near-term. Narrowing in on Moving Averages, the 200-day is at 38.69, the 50-day is 43.41, and the 7-day is resting at 41.93.
Investors may be watching other technical indicators such as the Williams Percent Range or Williams %R. The Williams %R is a momentum indicator that helps measure oversold and overbought levels. This indicator compares the closing price of a stock in relation to the highs and lows over a certain time period. A common look back period is 14 days. Koenig & Bauer AG (SKB.DE)s Williams %R presently stands at -65.37. The Williams %R oscillates in a range from 0 to -100. A reading between 0 and -20 would indicate an overbought situation. A reading from -80 to -100 would indicate an oversold situation.
The Relative Strength Index (RSI) is a highly popular technical indicator. The RSI is computed base on the speed and direction of a stocks price movement. The RSI is considered to be an internal strength indicator, not to be confused with relative strength which is compared to other stocks and indices. The RSI value will always move between 0 and 100. One of the most popular time frames using RSI is the 14-day. Using the 14-day RSI, if a stock price rose for 14 straight days, the value would be 100. If the stock fell for 14 straight days, the RSI value would be 0. The 14-day RSI is presently standing at 42.17, the 7-day sits at 40.03, and the 3-day is resting at 29.28.
Schreibt so einen Müll ein automatisches Computerprogramm? Oder erkenne ich nur den tieferen Sinn dieser Ausführungen nicht?
Optionen
| Boardmail an "Chaecka" |
Wertpapier: Koenig & Bauer AG |
Optionen
| Boardmail an "ulsi" |
Wertpapier: Koenig & Bauer AG |
die Aussage ist falsch - aufgrund der exponentiellen 27er-Glättung des RSI14 reichen 14 Abwärtstage NICHT um den RSI auf Null zu drücken.
Wirklich keine besonders gute Fundstelle.
Optionen
| Boardmail an "ulsi" |
Wertpapier: Koenig & Bauer AG |
Optionen
| Boardmail an "ulsi" |
Wertpapier: Koenig & Bauer AG |
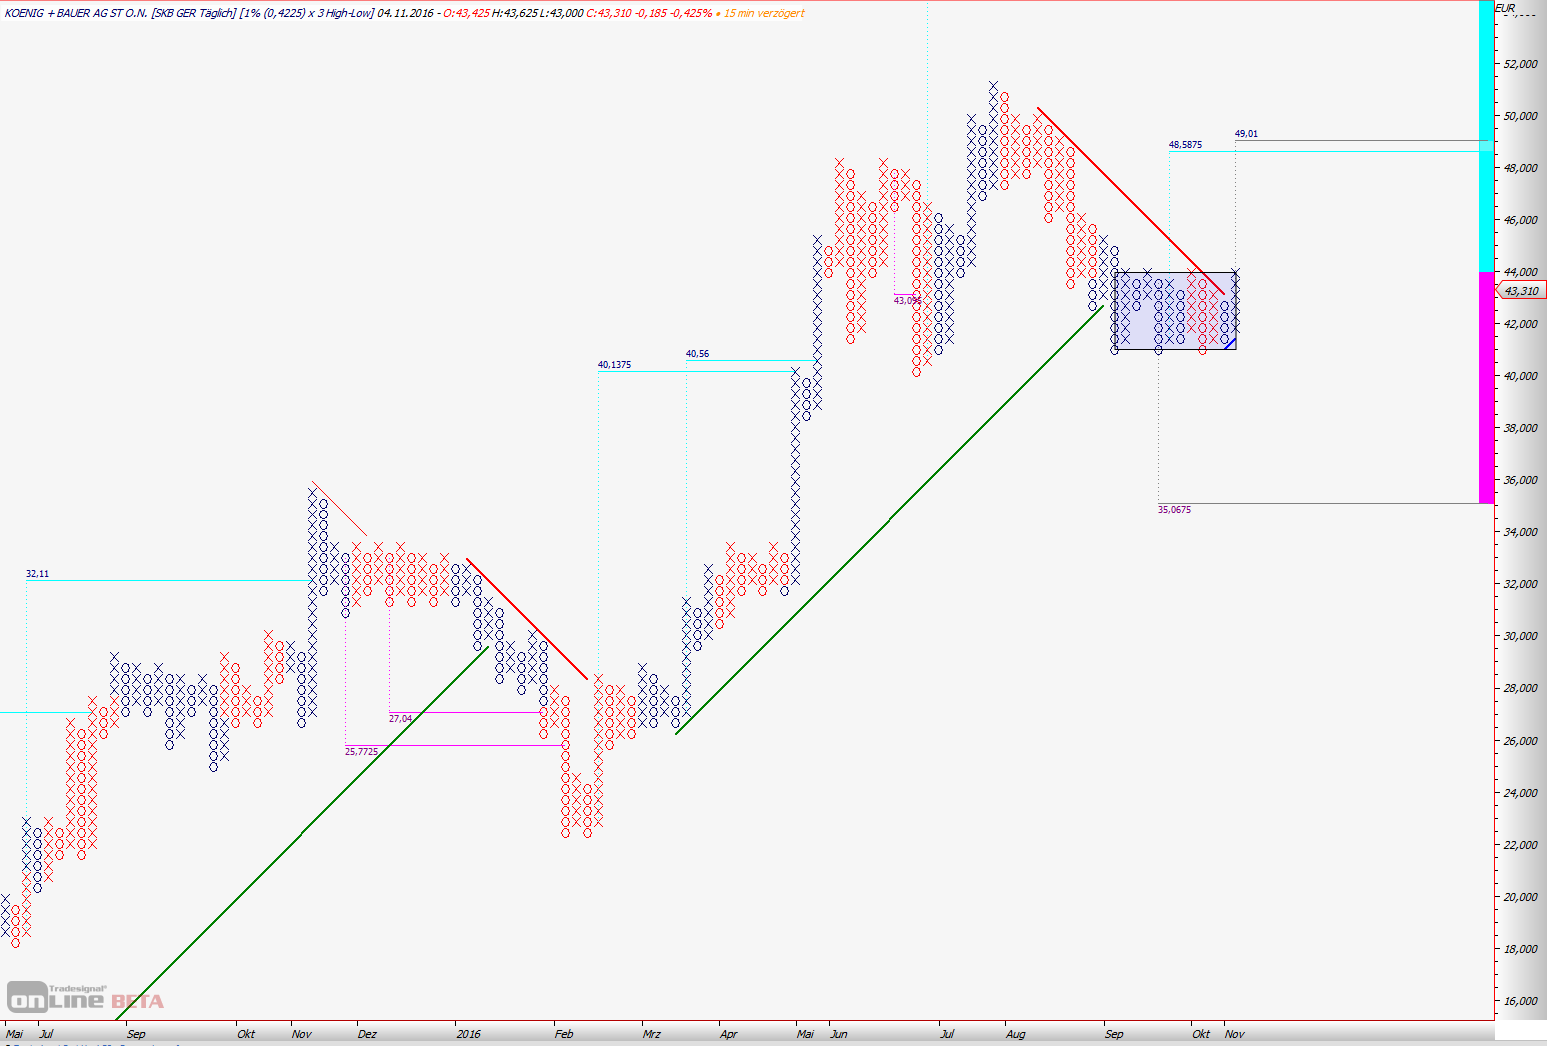
Angehängte Grafik:
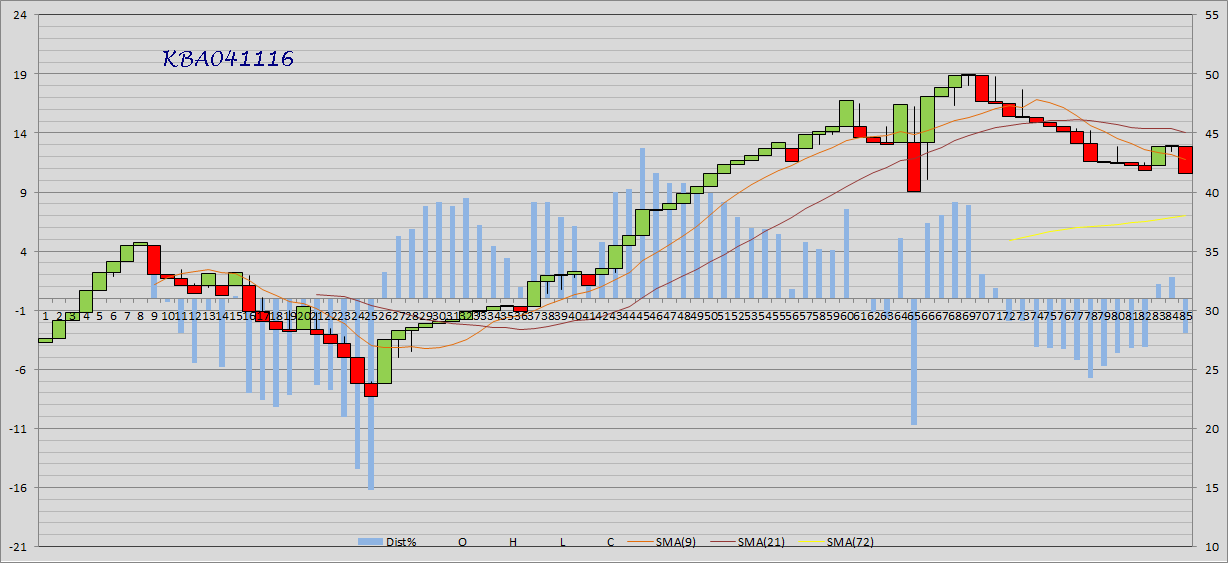
kba041116.png (verkleinert auf 47%)
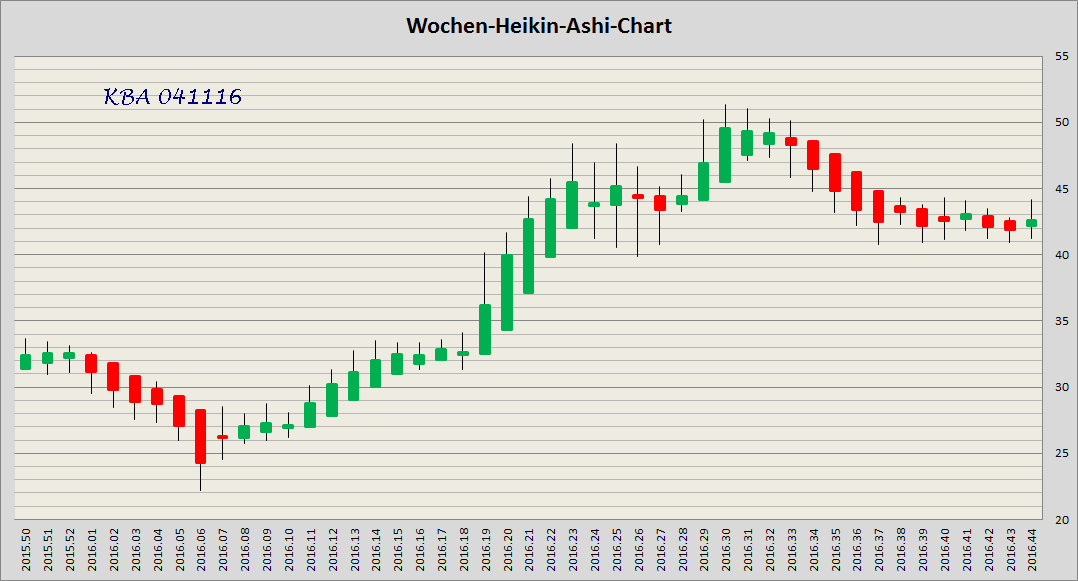
kba041116.png (verkleinert auf 47%)
Angehängte Grafik:
unbenannt.png (verkleinert auf 33%)
unbenannt.png (verkleinert auf 33%)
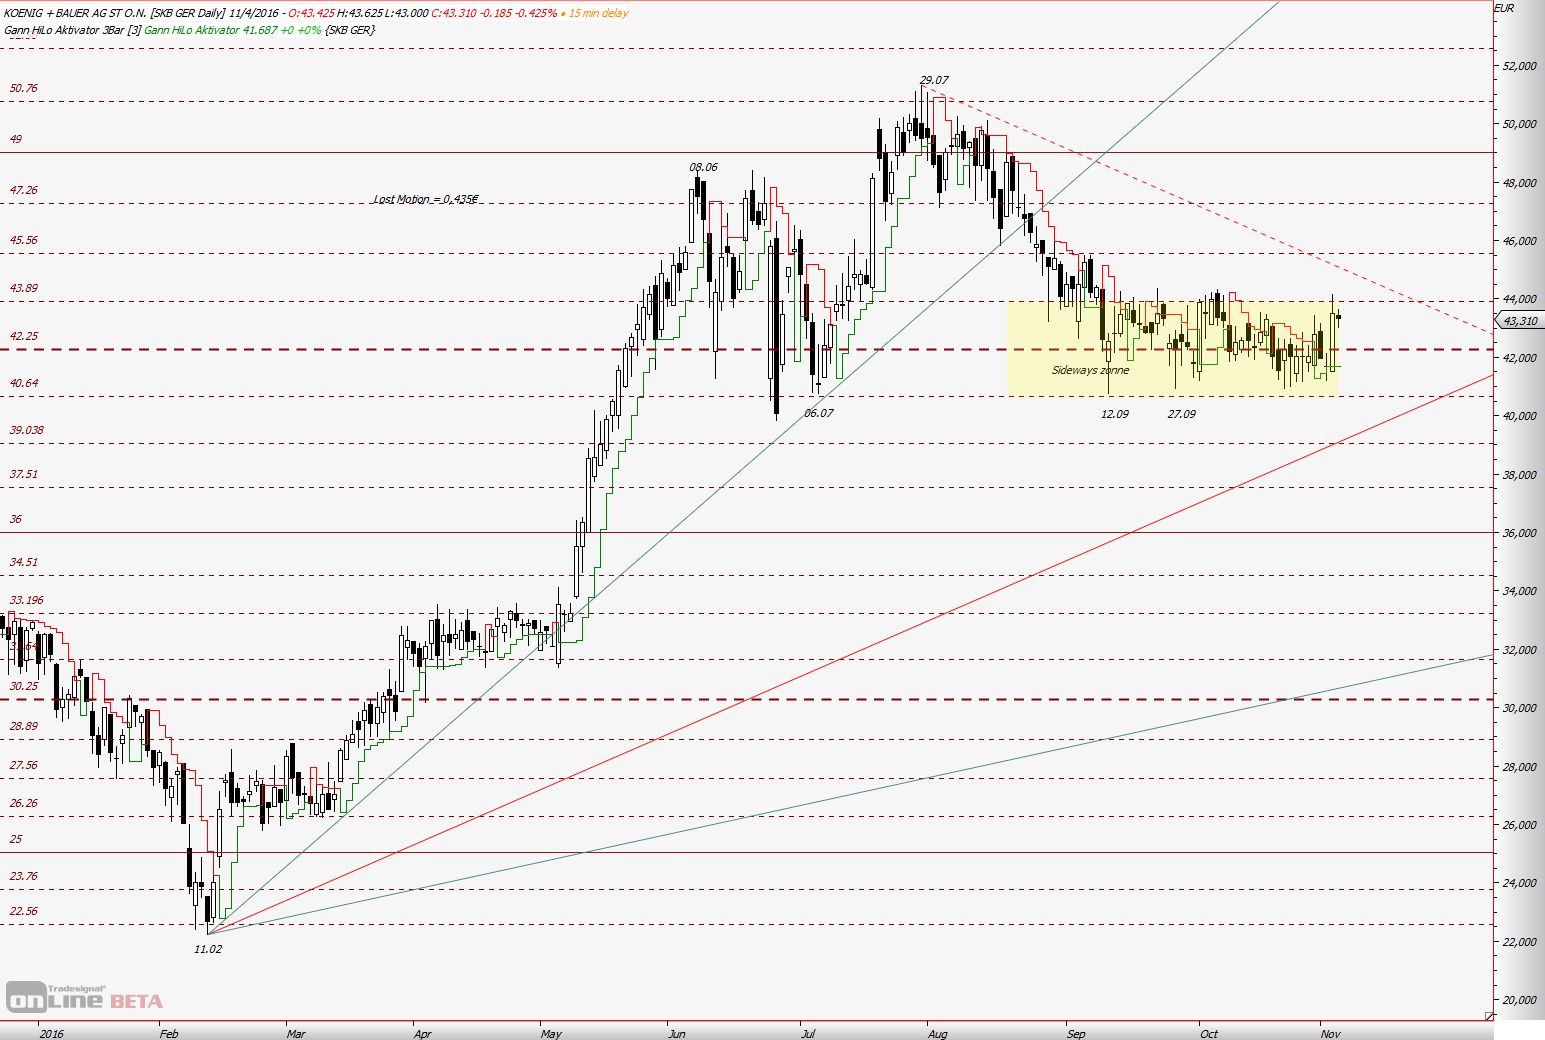
Würde z.B. Kurs in der nächsten Woche ausbrechen, dann hätten wir nach P&F Kursziele nach unten ca. 26€ und nach oben 56€
Angehängte Grafik:
unbenannt.png (verkleinert auf 32%)
unbenannt.png (verkleinert auf 32%)
Optionen
| Boardmail an "ulsi" |
Wertpapier: Koenig & Bauer AG |
Angehängte Grafik:
kba041116b.png (verkleinert auf 41%)
kba041116b.png (verkleinert auf 41%)
Optionen
| Boardmail an "ulsi" |
Wertpapier: Koenig & Bauer AG |
Angehängte Grafik:
kba111116.png (verkleinert auf 40%)
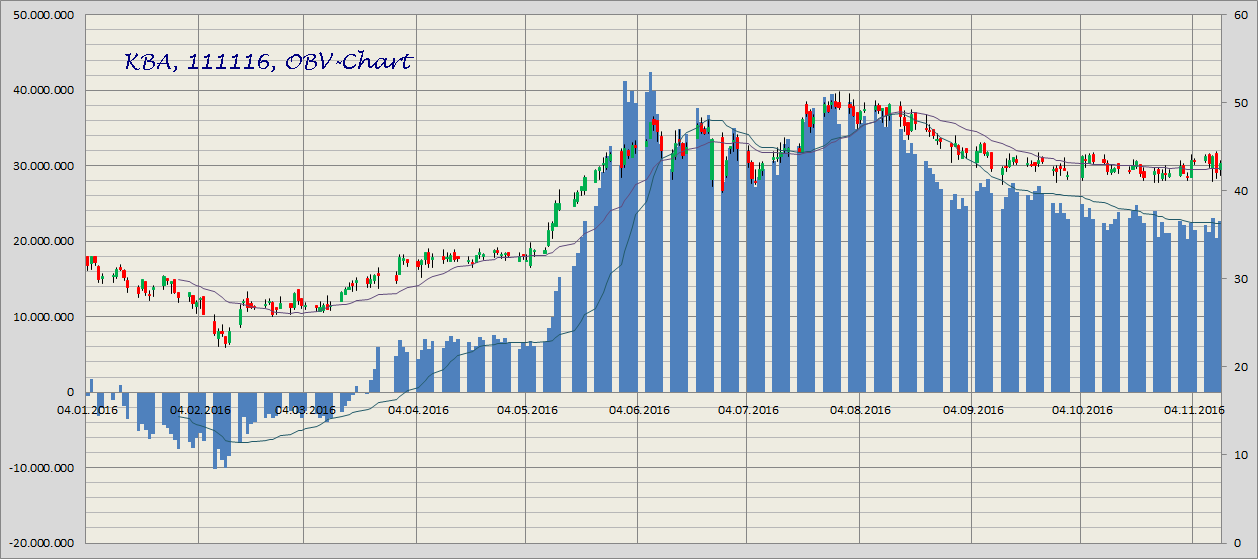
kba111116.png (verkleinert auf 40%)
Danke!
Optionen
| Boardmail an "Chaecka" |
Wertpapier: Koenig & Bauer AG |
- die Empfehlung stimmt: man wird nie wieder was von den "Followern" hören.
- stimmt nicht: man kann sich wüste Beschimpfungen und Häme anhören.
CT operiert mit Wahrscheinlichkeiten, also wird es auch Fall 2 geben.
wenns dir nur ums Lernen geht: Eine Divergenz zw einem Volumenindikator und dem Preis wird als negativ angesehen. Genaueres zum OBV findest du hier
http://stockcharts.com/school/...cal_indicators:on_balance_volume_obv
interessiert du dich für das Ergebnis einer bestimmten Strategie: No Problem, kann ich dir ausrechnen, muß nur formalisierbar sein.
Optionen
| Boardmail an "ulsi" |
Wertpapier: Koenig & Bauer AG |
Optionen
| Boardmail an "ulsi" |
Wertpapier: Koenig & Bauer AG |
Angehängte Grafik:
kba181116.png (verkleinert auf 47%)
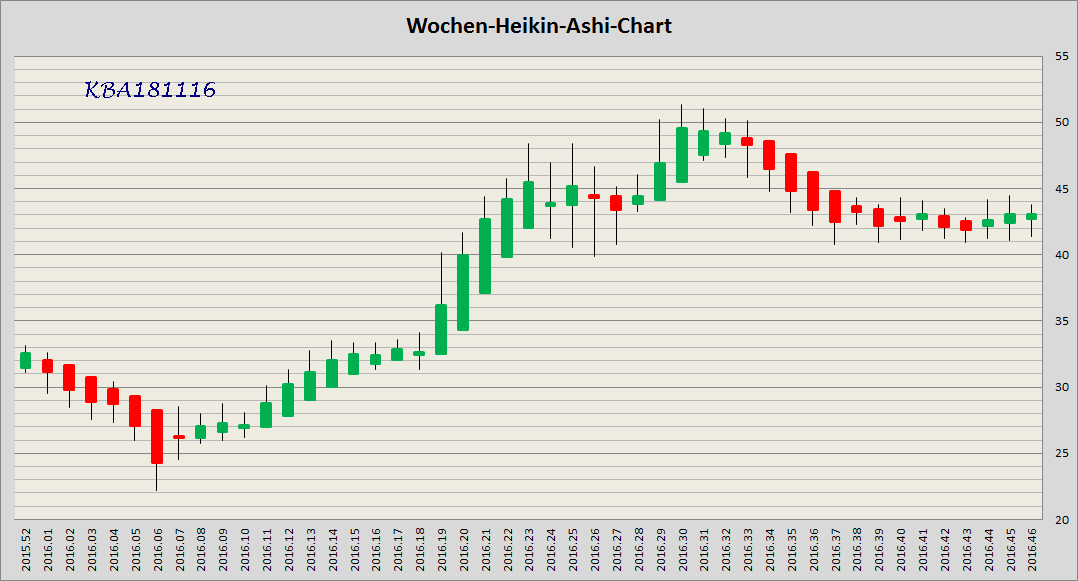
kba181116.png (verkleinert auf 47%)
Optionen
| Boardmail an "ulsi" |
Wertpapier: Koenig & Bauer AG |
Ich persönlich würde sagen, dass dieser Ausbruch zu 70% sicher ist. Oder lehne ich mich zu weit aus dem Window? :-)
Angehängte Grafik:
unbenannt.png (verkleinert auf 31%)
unbenannt.png (verkleinert auf 31%)
Gedanken dazu?
Optionen
| Boardmail an "ulsi" |
Wertpapier: Koenig & Bauer AG |
2. Im Fall, dass d. Trade für mich läuft, peile ich zwischenziel bei Hoch vom 29.07 (ca. 50€) an. Wird dieser gebrochen - zeigt ja weiter höher: 58€
Optionen
| Boardmail an "ulsi" |
Wertpapier: Koenig & Bauer AG |
Optionen
| Boardmail an "ulsi" |
Wertpapier: Koenig & Bauer AG |
Optionen
| Boardmail an "ulsi" |
Wertpapier: Koenig & Bauer AG |
Angehängte Grafik:
kba251116.png (verkleinert auf 47%)
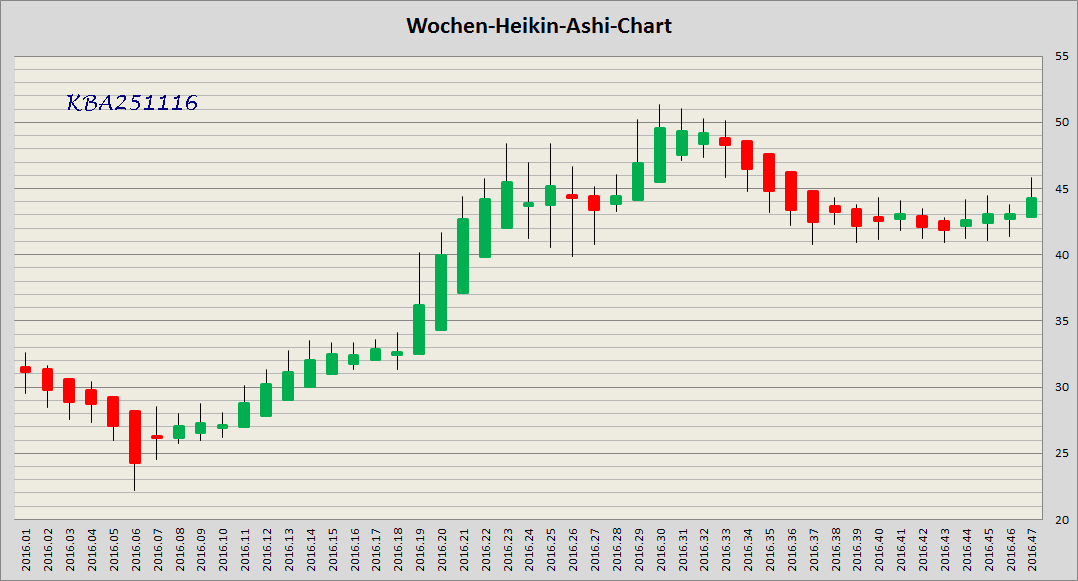
kba251116.png (verkleinert auf 47%)