Citigroup - nur Fakten, kein gelaber!
Darüber warst Du aber völlig anderer Meinung !
Der Tag wird kommen, wo diese Leute uns das Licht ausblasen - oder besser gesagt uns Fenster zur weiten Welt abdrehen.
http://www.spiegel.de/netzwelt/netzpolitik/0,1518,700136,00.htmlLOL
Optionen
| Boardmail an "Akhenate" |
Wertpapier: Citigroup |
http://www.manager-magazin.de/unternehmen/banken/...C719756%2C00.html
Optionen
| Boardmail an "brunneta" |
Wertpapier: Citigroup |
inclusive der Ratingagenturen nicht alle vor Gericht gezerrt werden.
http://www.microstockprofit.com/2011/02/15/...roup-inc-c-9/#more-7597
Tuesday, February 15th, 2011 in Trade Alerts : by Admin
Citigroup (C) is a global financial services company with approximately 200 million customer accounts in more than 140 countries. Through Citicorp and Citi Holdings, Citigroup provides consumers, corporations, governments and institutions with a broad range of financial products and services, including consumer banking and credit, corporate and investment banking, securities brokerage, transaction services and wealth management.
The Company was founded in 1812 and is based in New York, New York.
Share Statistics (14-Feb-11) FY
2009
FY
2010
%
Chg
Q4
2009
Q4
2010
%
Chg
Symbol C§Revenue, $Mn 91.1B 86.6B -5.0% 5.4B 18.4B 240.7%
Current price $4.91 Gross marg. n/a n/a n/a n/a n/a n/a
52wk Range: $3.15-$5.15 Oper. margin n/a 15.2% n/a n/a 5.8% n/a
Avg Vol (3m): 541.55M Net margin n/a n/a n/a n/a n/a n/a
Market Cap. 142.68B
Shares Outstanding 29.05B EPS, $ -0.76 0.35 -146.1% -0.17 0.04 -123.5%
Source: Reuters.com, SEC Filings.
Investment Highlights
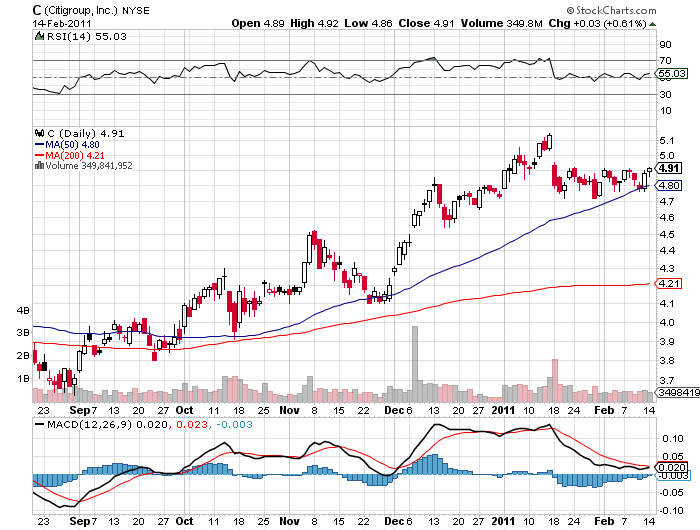
Shares of Citigroup moved up $0.03, or 0.61%, to close Monday at $4.91. Approximately 352 million shares traded hands for the day, versus an average day of 482.96 million shares. The stock remains above its 50-day moving average of $4.86 and its 200-day moving average of $4.31. Market capitalization currently stands at $142.64 billion and it has 29.05 billion outstanding shares.
Banking giant Citigroup is reportedly hiring as many as 20 senior corporate and investment bankers in Europe in the first-half of this year. In an interview with Bloomberg, Manuel Falco and James Bardrick, Citigroup’s joint heads of banking in Europe, the Middle East and Africa, said the firm will be focusing on “countries and regions where activity is likely to grow quickly, including Russia, Turkey and the Middle East.”
“Our balance sheet has been recapitalized, and we are in a position to deploy capital to our core clients to support their businesses and growth. The banking business is now in the best position it’s been in for years,” the report quoted Bardrick as saying.
Other News
Citigroup recently said its Global Transaction Services business, acting through Citibank N.A., has been appointed by UK retailer Debenhams plc (Debenhams) as depositary for its sponsored Level 1 American Depositary Receipt (ADR) program. Debenhams’ ADRs trade in the OTC marketplace under the symbol DBHPL, with each ADR representing 4 ordinary shares. Debenhams’ ordinary shares are listed on the London Stock Exchange.
Also recently, Citigroup announced that it has been appointed by Eos Partners to provide a comprehensive suite of back- and middle-office hedge fund administration services for its four Eos Credit Funds. The services include bank loan administration, document management, and loan portfolio analytics. This latest mandate adds to the firm’s existing portfolio of $65 billion in bank loan assets under administration and custody.
Reuters on Monday reported the closure of Citigroup’s local branch in Ivory Coast, following suit with BNP Paribas. The report cited a senior official of the local unit as saying. According to the report, the unnamed official said “the operations had been forced to close because of problems clearing cheques since the West African central bank severed ties with Ivory Coast, whose political crisis over a disputed poll has wrought havoc on the economy.”
Source: www.citigroup.com
Financial Summary
Citigroup reported fourth-quarter 2010 net income of $1.3 billion, or $0.04 per diluted share, compared to a net loss of $7.6 billion, or $0.33 per diluted share, in the fourth quarter 2009. Citigroup net income for full year 2010 was $10.6 billion, or $0.35 per diluted share, compared to a net loss of $1.6 billion, or $0.80 per share, in the full year 2009.
Citigroup revenues in the fourth quarter 2010 were $18.4 billion and included negative CVA of $1.1 billion. Excluding CVA, revenues of $19.5 billion were down 6% from the prior quarter, principally driven by lower Securities and Banking revenues and lower gains on sale of AFS securities in Corporate/Other.
Citicorp’s net income remained strong in 2010 at $14.9 billion, while Citi Holdings net loss decreased 52%, from $8.9 billion to $4.2 billion, when compared to 2009. Citi Holdings’ assets stood at $359 billion at the end of 2010, down from $487 billion at the end of 2009. This performance helped Citi to continue to improve its capital strength, as its Tier 1 Common ratio increased from 9.6% to 10.7% over the course of the year.
Citigroup’s total allowance for loan losses was $40.7 billion at quarter end, or 6.31% of total loans, down from $43.7 billion, or 6.73%, in the prior quarter driven, in part, by asset sales and lower non-accrual loans.
Citigroup reported fourth-quarter 2010 net income of $1.3 billion, or $0.04 per diluted share, compared to a net loss of $7.6 billion, or $0.33 per diluted share, in the fourth quarter 2009. Citigroup net income for full year 2010 was $10.6 billion, or $0.35 per diluted share, compared to a net loss of $1.6 billion, or $0.80 per share, in the full year 2009.
Citigroup revenues in the fourth quarter 2010 were $18.4 billion and included negative CVA of $1.1 billion. Excluding CVA, revenues of $19.5 billion were down 6% from the prior quarter, principally driven by lower Securities and Banking revenues and lower gains on sale of AFS securities in Corporate/Other.
Citicorp’s net income remained strong in 2010 at $14.9 billion, while Citi Holdings net loss decreased 52%, from $8.9 billion to $4.2 billion, when compared to 2009. Citi Holdings’ assets stood at $359 billion at the end of 2010, down from $487 billion at the end of 2009. This performance helped Citi to continue to improve its capital strength, as its Tier 1 Common ratio increased from 9.6% to 10.7% over the course of the year.
Full Year 2010 Key Items:
Citigroup net income was $10.6 billion, compared to a net loss of $1.6 billion in 2009.
Citigroup revenues1 were $86.6 billion, down 5% from $91.1 billion in 2009.
Citicorp revenues were $65.6 billion, down 4% from 2009, as 3% growth in both Regional Consumer Banking and Transaction Services, was more than offset by a decline in Securities and Banking.
Citi Holdings revenues were $19.3 billion, down 42% from 2009, mainly due to the absence of the $11.1 billion gain on sale of Smith Barney recorded in the prior year as well as lower overall assets.
Corporate/Other revenues of $1.8 billion compared to negative $10.6 billion in 2009. Prior year revenues included the $10.1 billion loss associated with the TARP repayment and exiting of the loss-sharing agreement with the U.S. government.
Citigroup expenses were $47.4 billion, down $447 million, or 1%, from 2009.
Citigroup provisions for credit losses and for benefits and claims1 declined $25.7 billion, or 50%, to $26.0 billion.
Citicorp generated 59% of its revenues and 76% of its net income from its international operations.
International Regional Consumer Banking:
Revenues were $17.7 billion, up 9% from prior year.
Net income more than doubled to $4.2 billion.
Net credit margin was up 21% to $14.3 billion or 12.5% of average loans.
Average deposits of $150 billion were up 12%.
Average loans of $114 billion increased 12%.
Cards purchase sales of $105 billion grew 17%.
Citigroup’s total allowance for loan losses was $40.7 billion, or 6.31% of loans. Allowance for loan losses at 209% of non-accrual loans.
Citigroup’s non-accrual loans were $19.4 billion, down 13% sequentially and 39% year over year.
Book Value per share was $5.61. Tangible Book Value2 per share was $4.45.
Source: www.citigroup.com
Financial Strength (14-Feb-2011) Company Industry Sector S&P 500
Quick Ratio (MRQ) – 0.00 0.21 0.54
Current Ratio (MRQ) – 0.00 2.69 0.83
LT Debt to Equity (MRQ) 232.75 54.30 85.15 107.70
Total Debt to Equity (MRQ) 396.91 210.41 205.47 152.39
Interest Coverage (TTM) – 0.00 25.43 15.78
Source: Reuters.com, SEC Filings.
Analyst Consensus
This is the consensus forecast among 21 polled investment analysts. Against the Citigroup Inc company.
Analyst Detail Buy Outperform Hold Underperform Sell No Opinion
Latest 7 4 7 2 1 0§
4 weeks ago 7 4 7 1 1 0
2 months ago 7 4 7 1 1 0
3 months ago 7 4 7 1 1 0
Last year 4 2 9 1 2 0
The 20 analysts offering 12-month price targets for C have a median target of 5.55, with a high estimate of 6.90 and a low estimate of 4.00. The median estimate represents a 13.73% increase from the last price of 4.88.
Source: markets.ft.com
Consensus Estimates Analysis
# of Estimates Mean High Low 1 Year Ago
SALES (in millions)
Quarter Ending Mar-11 14 21,224.70 23,097.00 19,890.00 20,852.00
Quarter Ending Jun-11 12 21,059.10 22,715.00 19,932.00 21,457.00
Year Ending Dec-11 17 84,099.70 90,118.00 79,807.00 83,819.50
Year Ending Dec-12 16 87,757.20 93,321.00 80,935.00 88,462.00
EARNINGS (per share)
Quarter Ending Mar-11 19 0.10 0.15 0.06 0.07
Quarter Ending Jun-11 19 0.10 0.14 0.08 0.09
Year Ending Dec-11 23 0.43 0.55 0.32 0.38
Year Ending Dec-12 22 0.54 0.64 0.27 0.63
LT Growth Rate (%) 3 3.00 11.00 -8.00 1.50
Source: http://www.reuters.com/finance/stocks/financialHighlights?symbol=C.N
Technical Analysis
Source: http://stockcharts.com
Thursday, C closed above its 20-day moving average. This is generally considered to be an indication of a bullish trend.
C has been relatively stable recently. This is evidenced by the width of its Bollinger Bands, which are tighter than normal. Additionally, C is trading within its Bollinger Bands. This is a normal condition and suggests that the stock is neither overbought nor oversold relative to the recent price action.
C’s MACD is indicating a weak bearish signal. Although the indicator is above the critical level of 0, which implies that the underlying moving averages are bullish, the MACD has crossed below its 9-day moving average or signal line. This suggests that positive momentum has begun to slow.
Comparative Analysis
Company Name Ticker Price per Mrkt. Cap. P/E P/S
Feb-14-2011 symbol§Share, $ $ Mn 2010 2011 2010 2011
Bank of America Corp. BAC 14.89 150.17B 11.63 7.96 1.39 1.32
HSBC Holdings plc HBC 56.67 198.46B 15.48 10.96 2.01 n/a
JPMorgan Chase & Co. JPM 46.54 181.99B 9.86 8.39 1.77 1.70
U.S. Bancorp USB 28.68 55.09B 13.46 11.16 3.05 2.92
Wells Fargo & Company WFC 33.87 178.23B 12.14 9.62 2.08 1.98
Money Center Banks Median 9.98 n/a 2.30 n/a
Citigroup Inc. C 4.91 142.68B 11.42 9.09 1.70 1.62
Source: Thomson Financial
Source: Yahoo Finance
DO NOT BASE ANY INVESTMENT DECISION UPON ANY MATERIALS FOUND ON THIS REPORT. We are not registered as a securities broker-dealer or an investment adviser either with the U.S. Securities and Exchange Commission (the “SEC”) or with any state securities regulatory authority. We are neither licensed nor qualified to provide investment advice.
The information contained in our report should be viewed as commercial advertisement and is not intended to be investment advice. The report is not provided to any particular individual with a view toward their individual circumstances. The information contained in our report is not an offer to buy or sell securities. We distribute opinions, comments and information free of charge exclusively to individuals who wish to receive them.
Our newsletter and website have been prepared for informational purposes only and are not intended to be used as a complete source of information on any particular company. An individual should never invest in the securities of any of the companies profiled based solely on information contained in our report. Individuals should assume that all information contained in the report about profiled companies is not trustworthy unless verified by their own independent research.
Any individual who chooses to invest in any securities should do so with caution. Investing in securities is speculative and carries a high degree of risk; you may lose some or all of the money that is invested. Always research your own investments and consult with a registered investment advisor or licensed stock broker before investing.
Information contained in our report will contain “forward looking statements” as defined under Section 27A of the Securities Act of 1933 and Section 21B of the Securities Exchange Act of 1934. Subscribers are cautioned not to place undue reliance upon these forward looking statements. These forward looking statements are subject to a number of known and unknown risks and uncertainties outside of our control that could cause actual operations or results to differ materially from those anticipated. Factors that could affect performance include, but are not limited to, those factors that are discussed in each profiled company’s most recent reports or registration statements filed with the SEC. You should consider these factors in evaluating the forward looking statements included in the report and not place undue reliance upon such statements.
We are committed to providing factual information on the companies that are profiled. However, we do not provide any assurance as to the accuracy or completeness of the information provided, including information regarding a profiled company’s plans or ability to effect any planned or proposed actions. We have no first-hand knowledge of any profiled company’s operations and therefore cannot comment on their capabilities, intent, resources, nor experience and we make no attempt to do so. Statistical information, dollar amounts, and market size data was provided by the subject company and related sources which we believe to be reliable.
To the fullest extent of the law, we will not be liable to any person or entity for the quality, accuracy, completeness, reliability, or timeliness of the information provided in the report, or for any direct, indirect, consequential, incidental, special or punitive damages that may arise out of the use of information we provide to any person or entity (including, but not limited to, lost profits, loss of opportunities, trading losses, and damages that may result from any inaccuracy or incompleteness of this information).
We encourage you to invest carefully and read investment information available at the websites of the SEC at http://www.sec.gov and FINRA at http://www.finra.org.
Angehängte Grafik:
c.png (verkleinert auf 72%)
c.png (verkleinert auf 72%)